
Latency Atlas
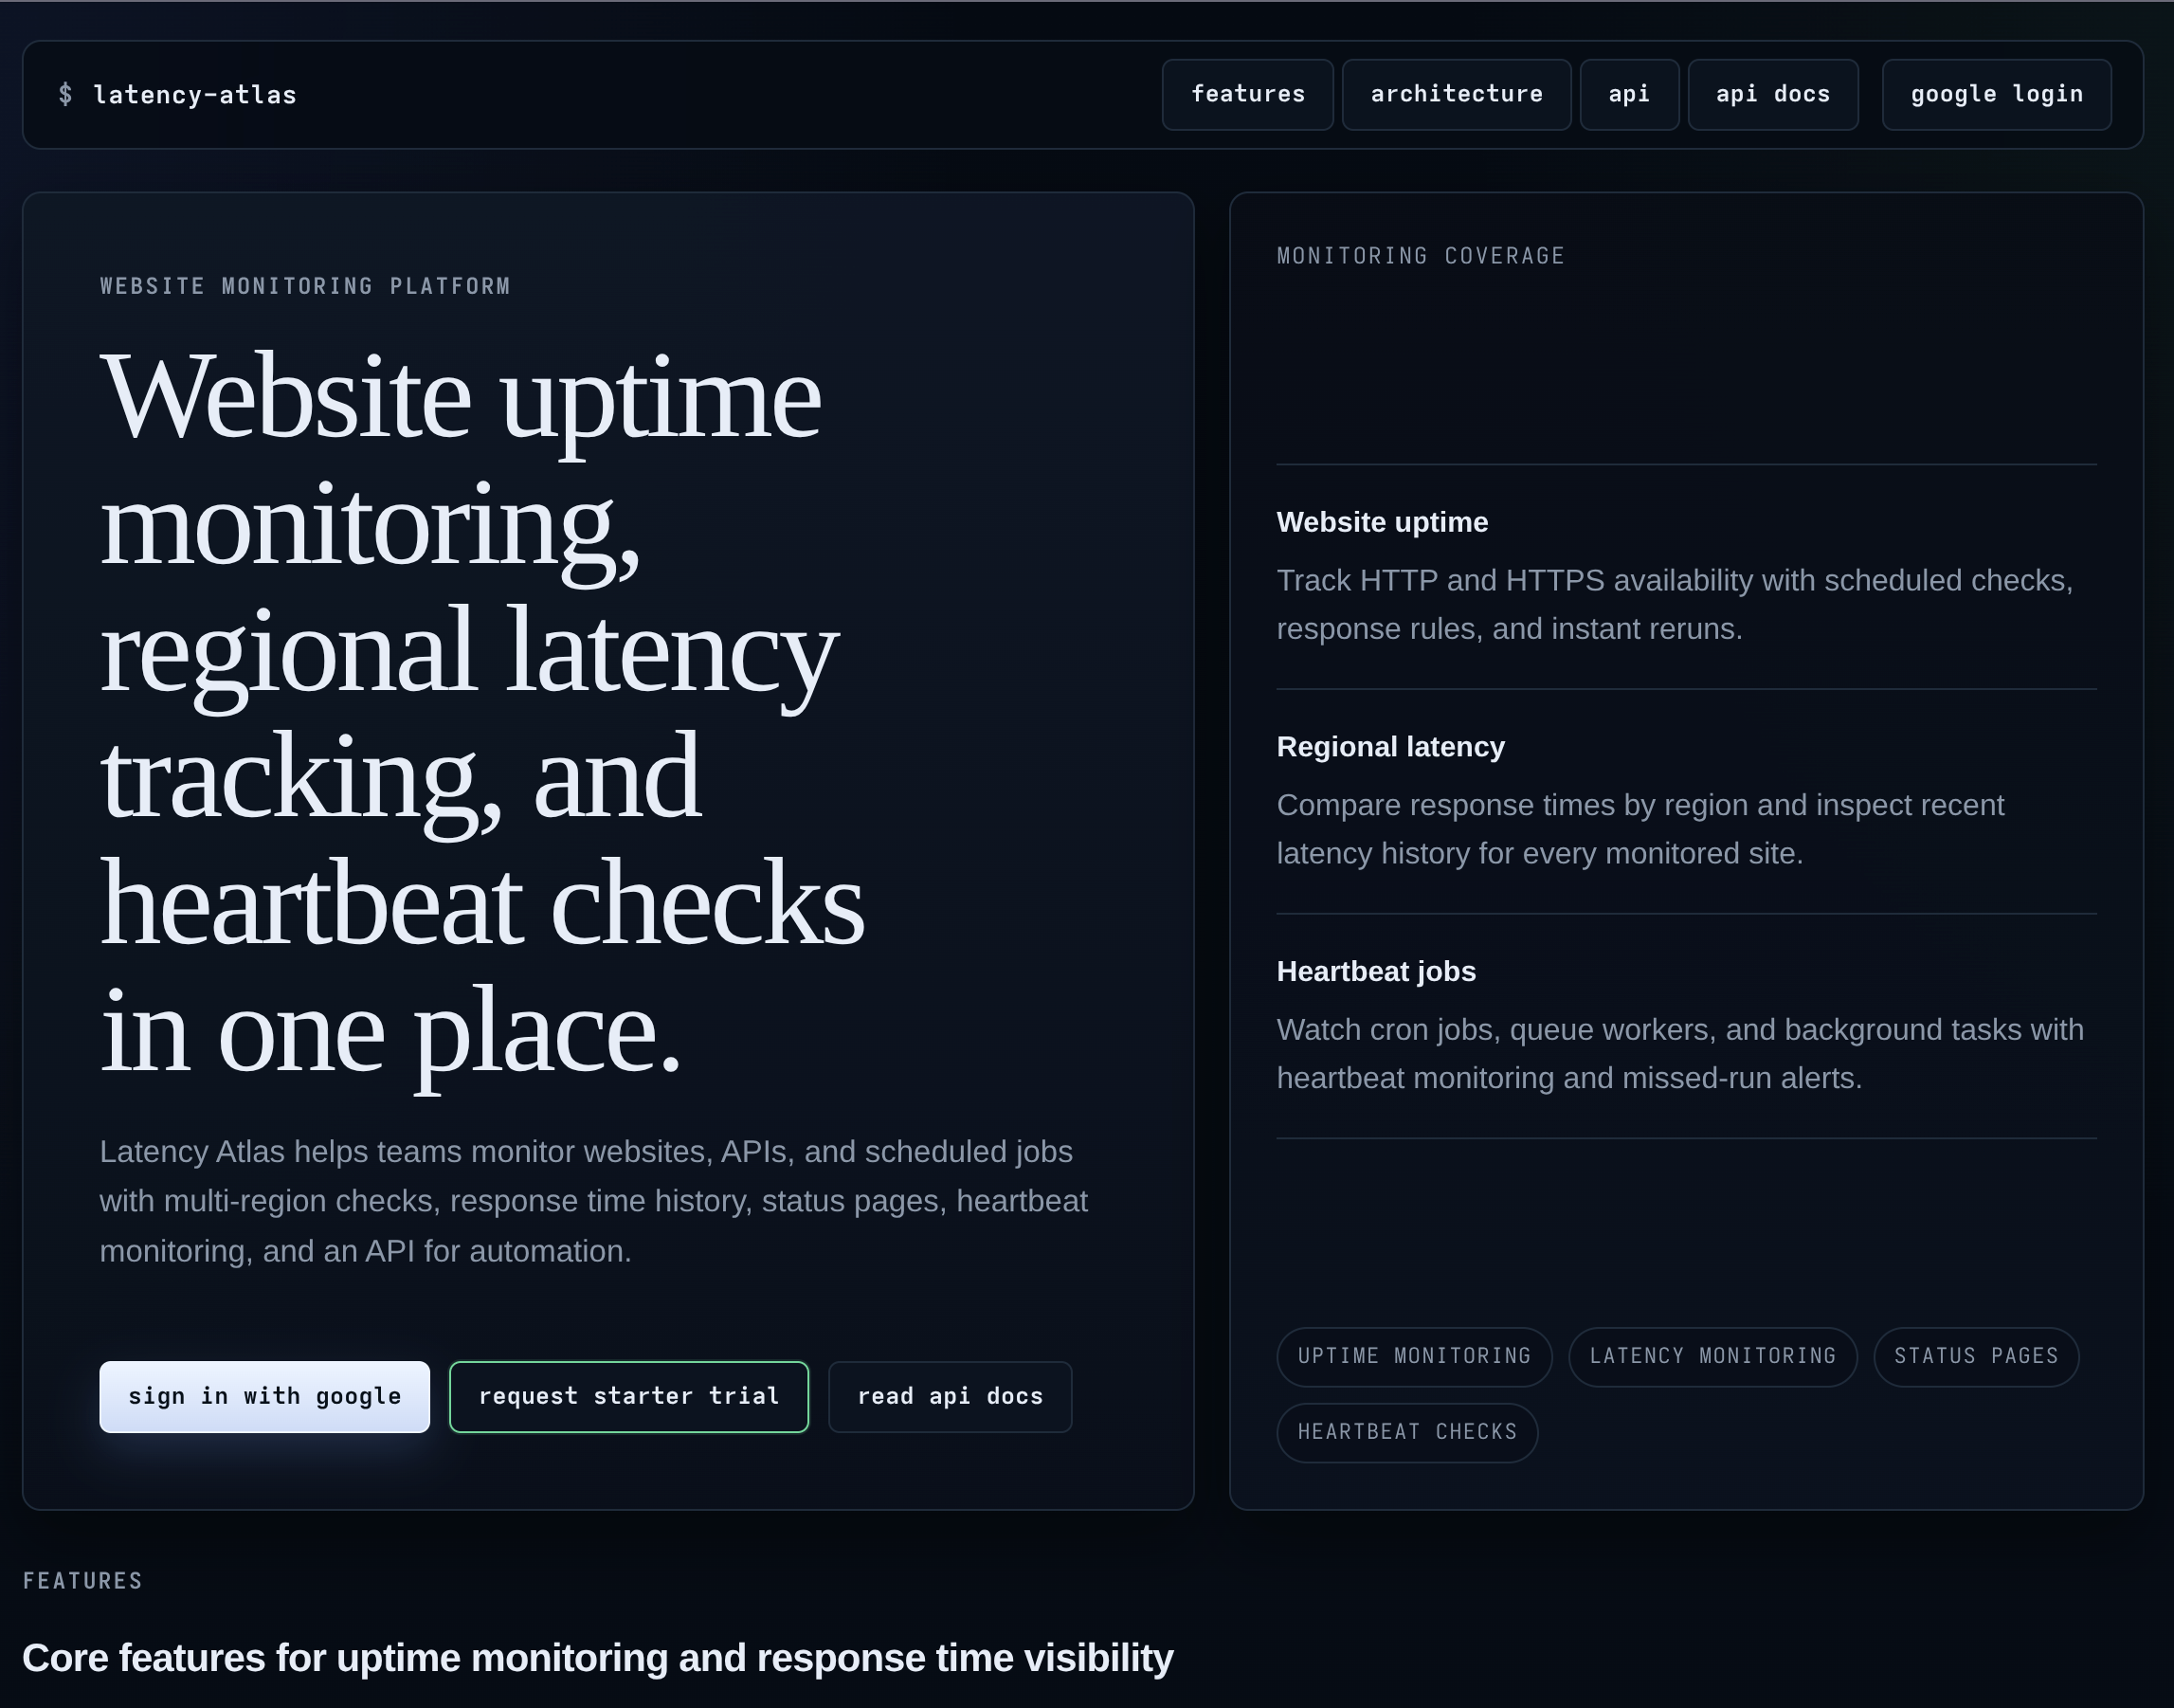
Website uptime monitoring, regional latency tracking, and he
Features
Website uptime
Track HTTP and HTTPS availability with scheduled checks, response rules, and instant reruns.
Regional latency
Compare response times by region and inspect recent latency history for every monitored site.
Heartbeat jobs
Watch cron jobs, queue workers, and background tasks with heartbeat monitoring and missed-run alerts.
Use Cases
01Multi-region uptime monitoring
Monitor one website from multiple regions, compare response time trends, and catch latency spikes before they become outages.
02Status pages and alerts
Expose public status pages, route notifications, and keep the latest incident state close to the checks that produced it.
03API-first automation
Create monitors, run checks, fetch result history, and read reports from the Developer API with team-scoped bearer tokens.

Comments






Latency Atlas has great potential and offers some useful features, but I encountered a few issues that could be improved. Please contact me so I can share detailed feedback and suggest the changes I'd like to see. WhatsApp: https://wa.me/447307349530 Email: [email protected] Telegram: t.me/rforrank


Latency Atlas consolidates uptime monitoring, regional latency tracking, and heartbeat checks for cron jobs into one tool — smart positioning since these are usually separate subscriptions. The dark, terminal-style UI works well for a developer audience, reinforced by the API and API docs links in the nav. Small nitpick: the tagline gets cut off on the Fazier listing ("...and he"), worth checking the character limit there.


The multi-region latency history is the part I find most useful — most uptime monitors only tell you up/down, but seeing response-time trends per region makes it much easier to spot a degrading CDN edge before users complain. Curious how the heartbeat monitoring handles jobs with variable schedules (e.g. cron that runs every 5–15 min) — is there a tolerance window setting?


The multi-region monitoring friction is exactly what this solves. Most teams I know either skip regional checks because they're complex to set up across multiple tools, or they're flying blind until a customer reports latency from Asia or Europe. Having response time trends by region built-in removes that blind spot. The heartbeat job monitoring angle is clever too - most services fail silently until page load tanks.

Does the free tier send instant alerts by text, or just email? I run a small web app as a solo founder, and my worry is that the site goes down and a paying customer finds out before I do. I don't need the cron and API depth — just the fastest possible "it's down" ping. If that part is easy to set up for someone who isn't a developer, this is exactly the kind of thing I'd keep running in the background.

Clean positioning and a practical feature set. I like that the focus isn't just on uptime but also on regional latency, heartbeat monitoring for background jobs, and API-first automation. Those are the kinds of capabilities that become important as applications grow beyond a single server. The public status pages and historical response data are also useful for communicating incidents and troubleshooting performance over time. Looks like a solid monitoring platform for startups and engineering teams.

Hi, I just discovered your project on Fazier and I really like the direction you’re taking. I noticed a strong growth opportunity that could help you reach more targeted users, especially through Reddit community marketing, citation building, and strategic email outreach. Many brands are missing thousands of potential customers because their audience is already discussing their problems, looking for recommendations, and searching for solutions inside niche communities. I help businesses turn those conversations into brand visibility, trust, traffic, and qualified leads through authentic Reddit engagement and conversion-focused email strategies. I’d love to share a few growth ideas tailored specifically to your project. Best Regards, Olayinka Adeoye +1 479 739 7382 (WHATSAPP)
For static-on-CDN sites the per-region view is the killer feature — up/down monitoring tells you nothing when your "outage" is actually one edge region serving cache misses at 800ms. Question: do the regional checks measure TTFB separately from full response time? On a CDN-hosted site that split is what distinguishes an origin problem from an edge problem. Bundling cron heartbeats in the same tool is smart — that's usually a second subscription.


Premium Products








































Sponsors
Buy



Makers

Makers
Comments
Latency Atlas has great potential and offers some useful features, but I encountered a few issues that could be improved. Please contact me so I can share detailed feedback and suggest the changes I'd like to see. WhatsApp: https://wa.me/447307349530 Email: [email protected] Telegram: t.me/rforrank
Latency Atlas consolidates uptime monitoring, regional latency tracking, and heartbeat checks for cron jobs into one tool — smart positioning since these are usually separate subscriptions. The dark, terminal-style UI works well for a developer audience, reinforced by the API and API docs links in the nav. Small nitpick: the tagline gets cut off on the Fazier listing ("...and he"), worth checking the character limit there.
The multi-region latency history is the part I find most useful — most uptime monitors only tell you up/down, but seeing response-time trends per region makes it much easier to spot a degrading CDN edge before users complain. Curious how the heartbeat monitoring handles jobs with variable schedules (e.g. cron that runs every 5–15 min) — is there a tolerance window setting?
The multi-region monitoring friction is exactly what this solves. Most teams I know either skip regional checks because they're complex to set up across multiple tools, or they're flying blind until a customer reports latency from Asia or Europe. Having response time trends by region built-in removes that blind spot. The heartbeat job monitoring angle is clever too - most services fail silently until page load tanks.
Does the free tier send instant alerts by text, or just email? I run a small web app as a solo founder, and my worry is that the site goes down and a paying customer finds out before I do. I don't need the cron and API depth — just the fastest possible "it's down" ping. If that part is easy to set up for someone who isn't a developer, this is exactly the kind of thing I'd keep running in the background.
Clean positioning and a practical feature set. I like that the focus isn't just on uptime but also on regional latency, heartbeat monitoring for background jobs, and API-first automation. Those are the kinds of capabilities that become important as applications grow beyond a single server. The public status pages and historical response data are also useful for communicating incidents and troubleshooting performance over time. Looks like a solid monitoring platform for startups and engineering teams.
Hi, I just discovered your project on Fazier and I really like the direction you’re taking. I noticed a strong growth opportunity that could help you reach more targeted users, especially through Reddit community marketing, citation building, and strategic email outreach. Many brands are missing thousands of potential customers because their audience is already discussing their problems, looking for recommendations, and searching for solutions inside niche communities. I help businesses turn those conversations into brand visibility, trust, traffic, and qualified leads through authentic Reddit engagement and conversion-focused email strategies. I’d love to share a few growth ideas tailored specifically to your project. Best Regards, Olayinka Adeoye +1 479 739 7382 (WHATSAPP)
For static-on-CDN sites the per-region view is the killer feature — up/down monitoring tells you nothing when your "outage" is actually one edge region serving cache misses at 800ms. Question: do the regional checks measure TTFB separately from full response time? On a CDN-hosted site that split is what distinguishes an origin problem from an edge problem. Bundling cron heartbeats in the same tool is smart — that's usually a second subscription.
Premium Products
New to Fazier?

Find your next favorite product or submit your own. Made by @FalakDigital.
Copyright ©2026. All Rights Reserved