
eCPM Bazaar
Diagnose mobile game ad revenue drops
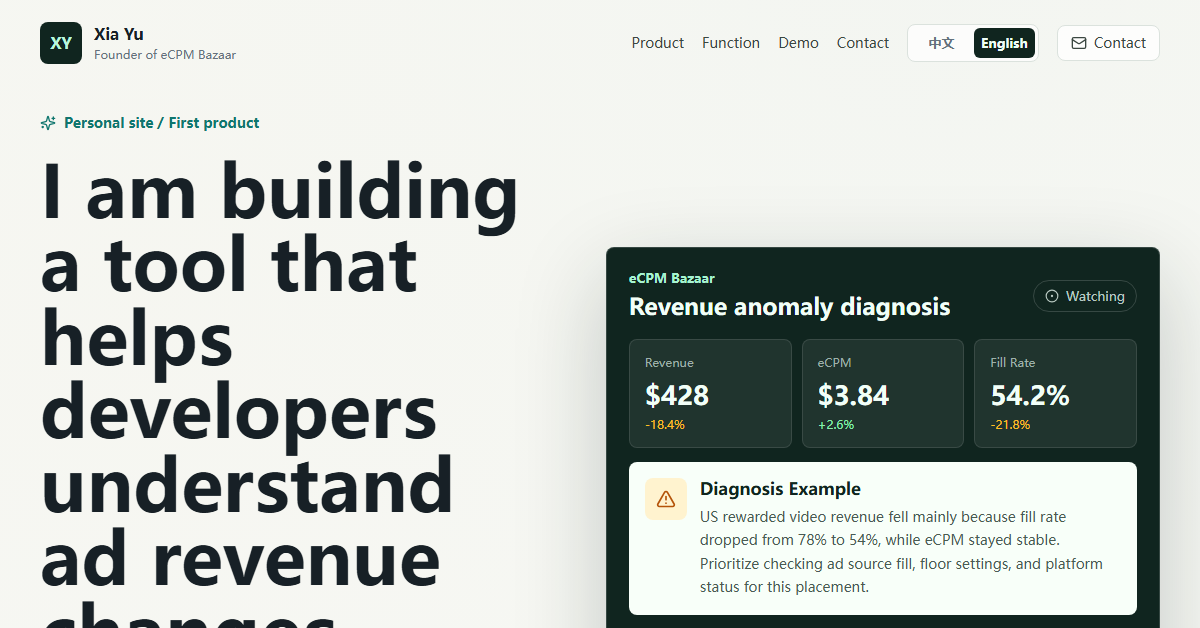
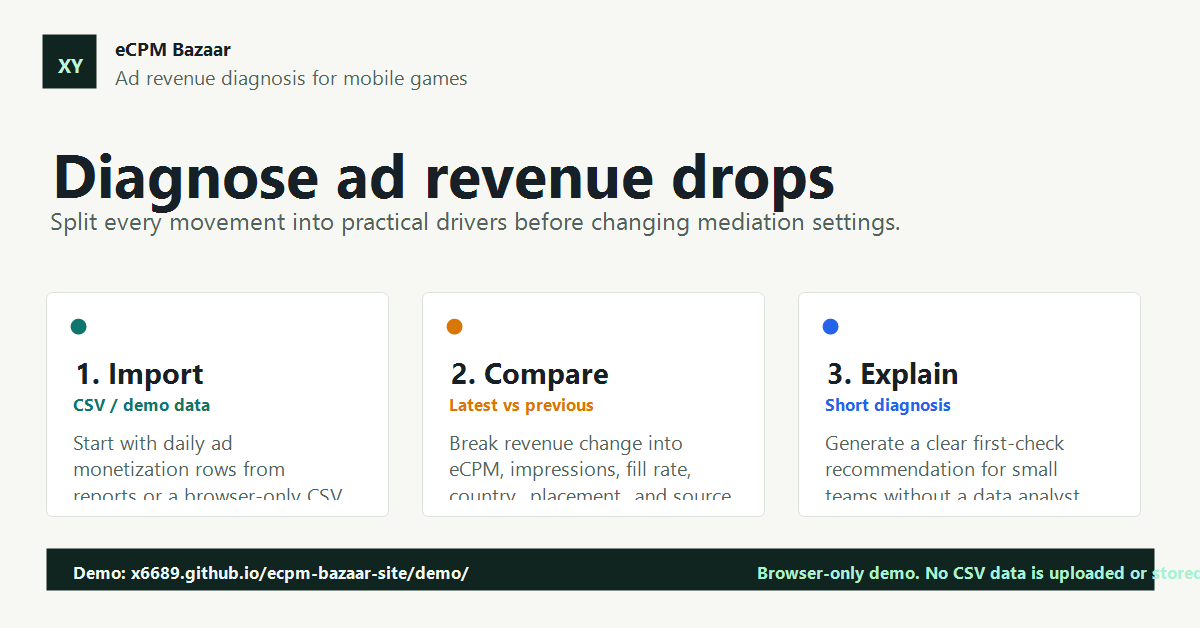
eCPM Bazaar helps mobile game and app developers diagnose ad revenue changes by splitting the movement into eCPM, impressions, fill rate, country, placement, and ad source performance.
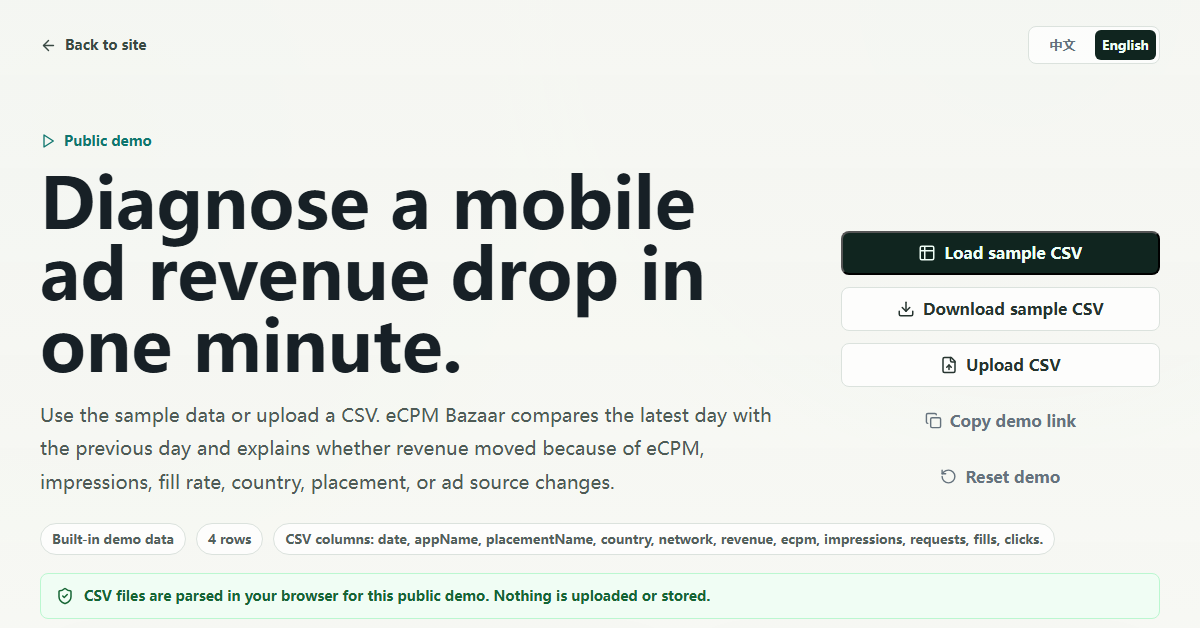
The public demo supports sample data and browser-only CSV upload, then generates a short diagnosis explaining the most likely driver of the change.
Features
- Diagnose ad revenue changes by eCPM, impressions, fill rate, country, placement, and ad source
- Browser-only public demo with built-in sample data
- CSV upload demo without storing or uploading user data
- Automatic comparison between latest day and previous day
- Short diagnosis summary explaining the most likely revenue driver
Use Cases
- Check why mobile game ad revenue dropped yesterday
- Separate eCPM drops from impression, fill rate, or traffic mix changes
- Compare monetization by country, placement, and ad source
- Sanity-check CSV ad monetization reports before changing mediation settings
- Help indie developers understand AdMob, AppLovin MAX, Unity LevelPlay, or TopOn report changes

Comments


The biggest value here is the diagnostic breakdown. Most game developers wake up to a revenue drop and have no idea what caused it. Was it a fill rate crash? Did impressions tank? Did eCPM itself drop? Separating these variables is crucial because each points to a completely different action. The CSV demo approach is smart too - no need to upload raw data, just the aggregated numbers. Being browser-only means developers can actually use this during their morning coffee instead of waiting for dashboards to load or struggling with platform-specific APIs. Perfect tool for indie devs monitoring ad monetization.


I built eCPM Bazaar after seeing small mobile game teams spend too much time guessing why ad revenue moved. Most dashboards show numbers, but when revenue drops, developers still need to know whether the real driver is eCPM, impressions, fill rate, country mix, placement, or ad source performance. The current demo is intentionally simple: use sample data or upload a CSV in the browser, compare the latest day with the previous day, and get a short diagnosis. No data is uploaded or stored. I am looking for feedback from indie game and app developers who monetize with ads.
Splitting revenue movement into eCPM vs fill rate vs country is exactly the triage most devs do by hand in messy spreadsheets. The browser-only CSV upload is a good trust move since ad revenue data is sensitive. Would love to see it flag seasonality (Q4 vs Q1 eCPM swings) so people do not misread a January drop as a real problem.
Premium Products



































Sponsors
Buy

Makers
Makers
Comments
The biggest value here is the diagnostic breakdown. Most game developers wake up to a revenue drop and have no idea what caused it. Was it a fill rate crash? Did impressions tank? Did eCPM itself drop? Separating these variables is crucial because each points to a completely different action. The CSV demo approach is smart too - no need to upload raw data, just the aggregated numbers. Being browser-only means developers can actually use this during their morning coffee instead of waiting for dashboards to load or struggling with platform-specific APIs. Perfect tool for indie devs monitoring ad monetization.
I built eCPM Bazaar after seeing small mobile game teams spend too much time guessing why ad revenue moved. Most dashboards show numbers, but when revenue drops, developers still need to know whether the real driver is eCPM, impressions, fill rate, country mix, placement, or ad source performance. The current demo is intentionally simple: use sample data or upload a CSV in the browser, compare the latest day with the previous day, and get a short diagnosis. No data is uploaded or stored. I am looking for feedback from indie game and app developers who monetize with ads.
Splitting revenue movement into eCPM vs fill rate vs country is exactly the triage most devs do by hand in messy spreadsheets. The browser-only CSV upload is a good trust move since ad revenue data is sensitive. Would love to see it flag seasonality (Q4 vs Q1 eCPM swings) so people do not misread a January drop as a real problem.
Premium Products
New to Fazier?

Find your next favorite product or submit your own. Made by @FalakDigital.
Copyright ©2026. All Rights Reserved