
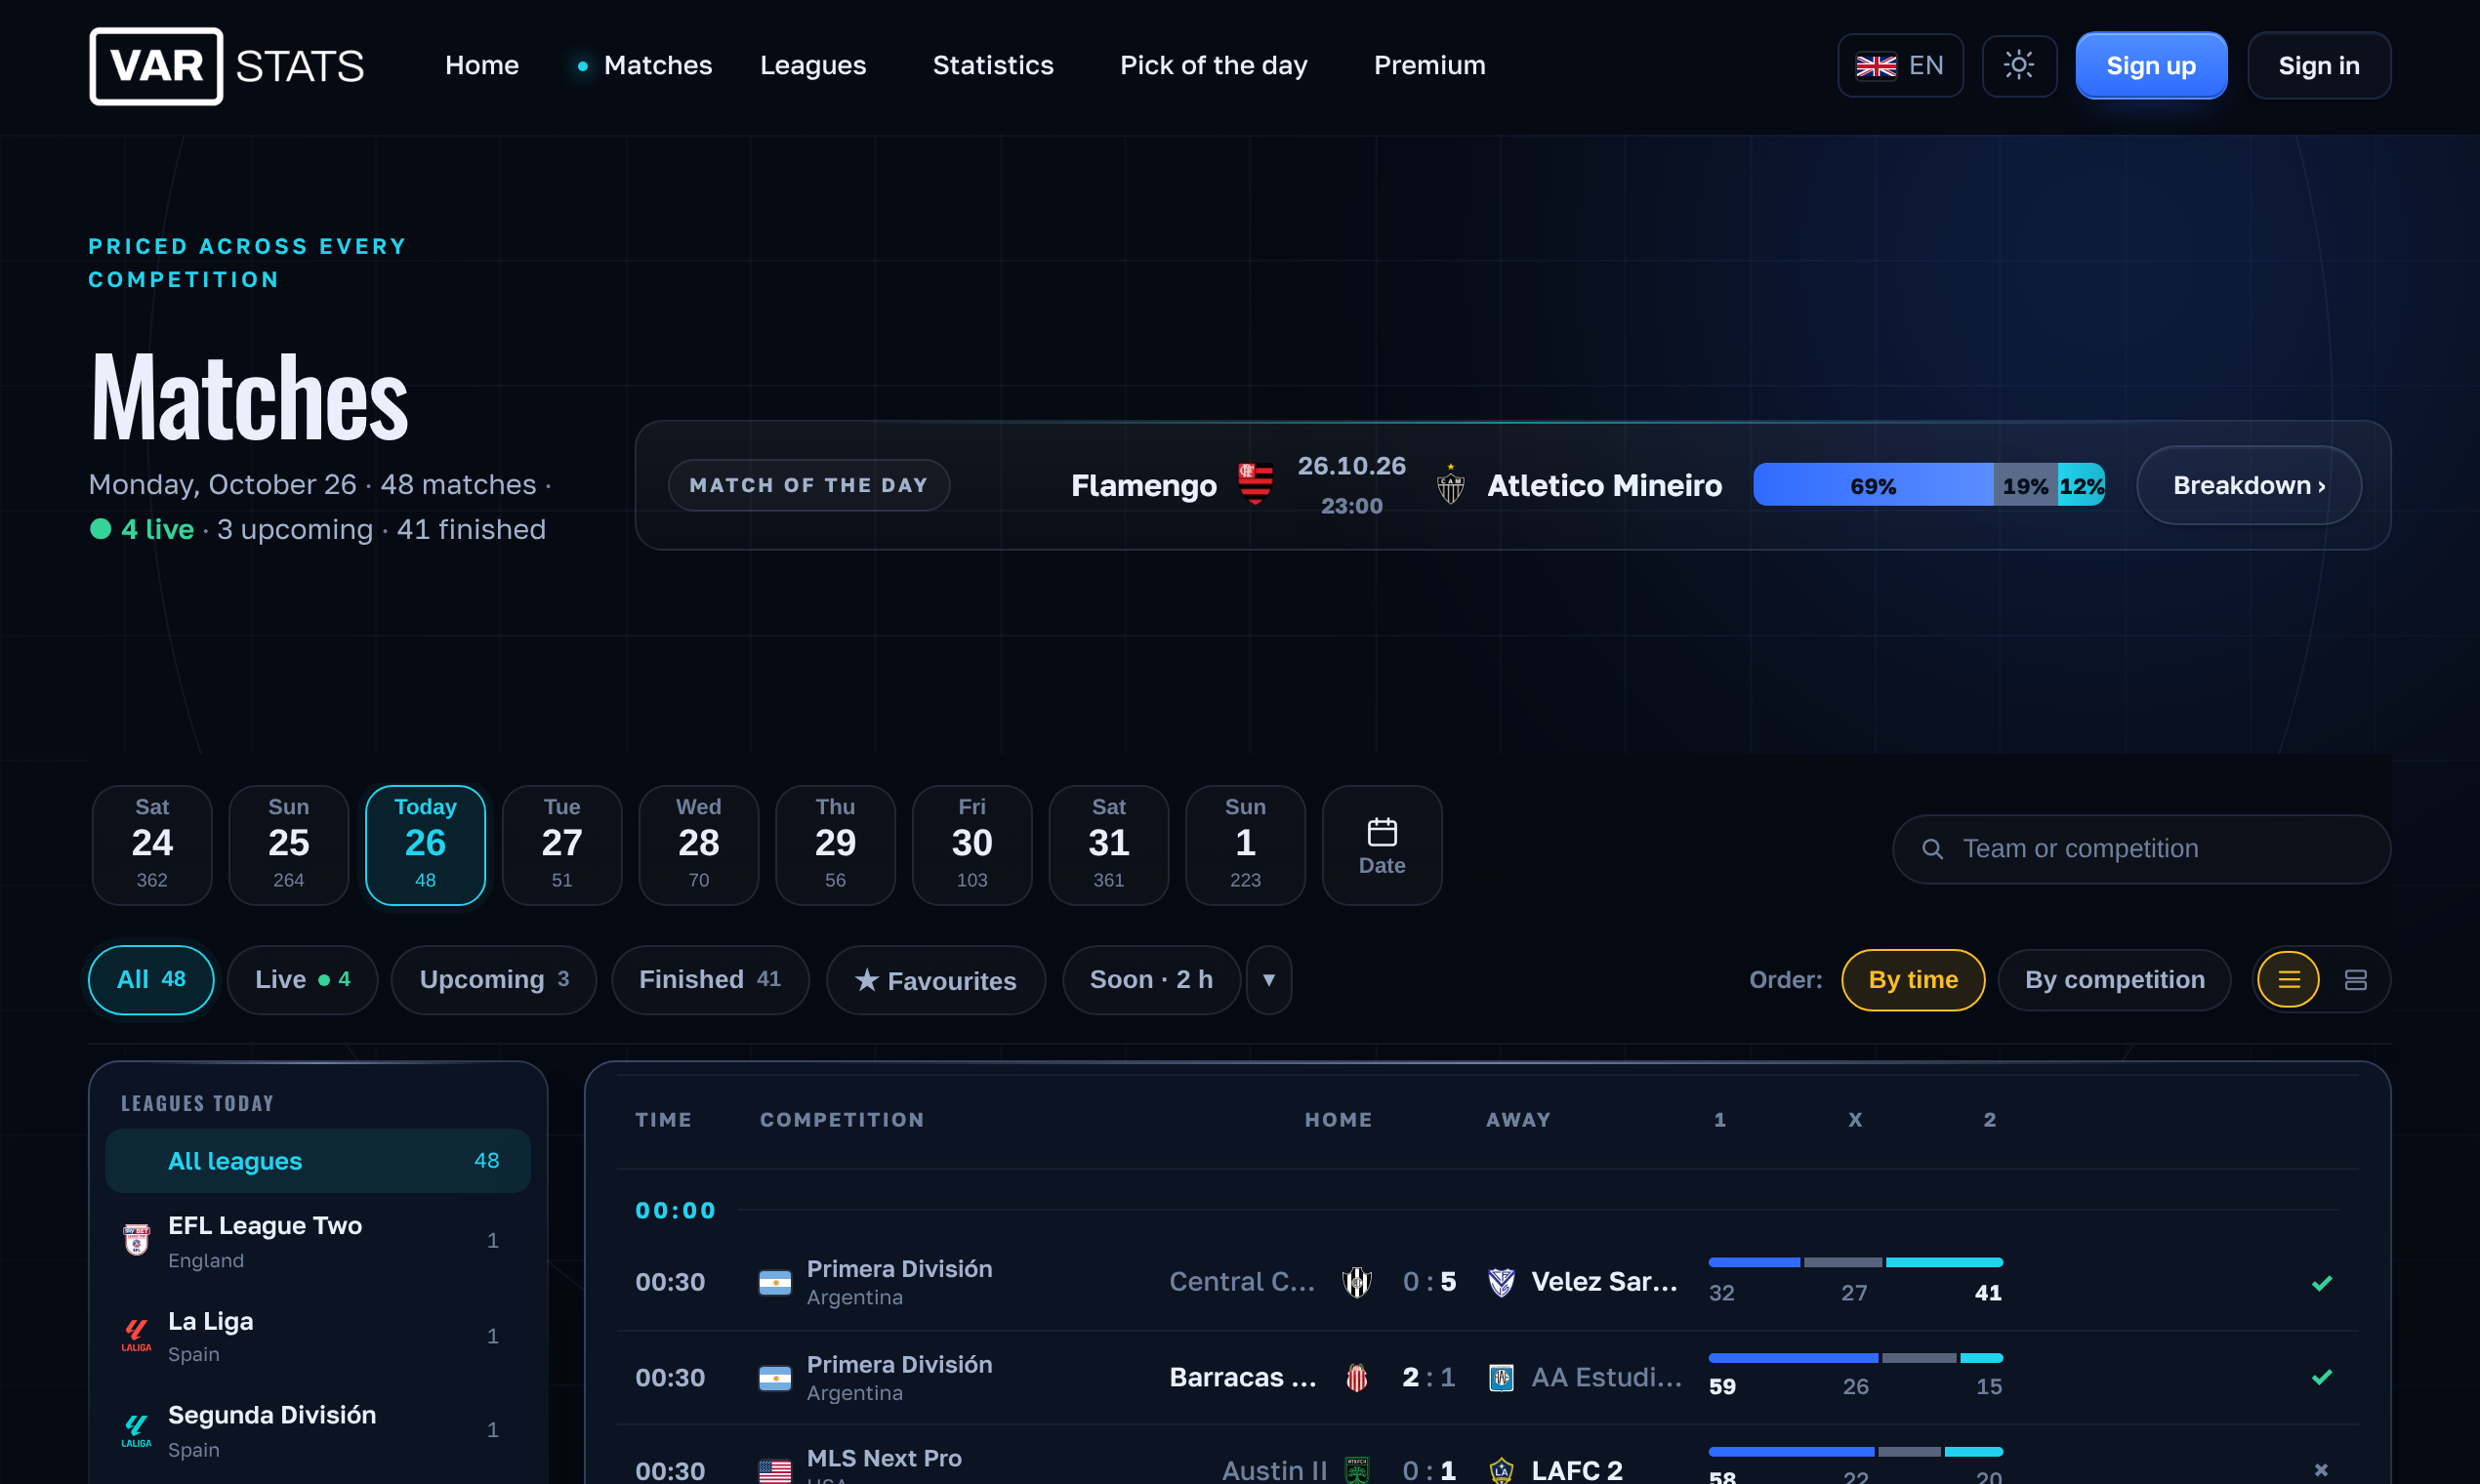
VARStats is a football analytics service that turns match statistics into probabilities. For 100+ leagues, European cups included, it estimates the chances of results, goal totals, corners and cards, and explains each estimate: team form, days of rest, fixture congestion, the referee's record. The model is a Dixon-Coles rating fitted separately for each league, with time-decayed form, home advantage, shot quality (xG, shots on target) and a referee adjustment for cards; probabilities are calibrated weekly against played matches. The site keeps an honest record: how many picks came through, where the model over- or under-promises, and what it does not do — no guaranteed wins. Available on the web in 9 languages, as an Android app and as a Telegram bot.
Features
• Probabilities for every match in 100+ leagues, European cups included: result, goal totals, corners and cards
• Each estimate explained: team form, days of rest, fixture congestion, referee record
• Dixon-Coles model fitted per league, with xG, shots on target and a referee adjustment for cards
• Calibrated weekly against played matches
• Public track record: how many forecasts came through, updated daily
• Pick of the day: the model's most confident forecast, with its history
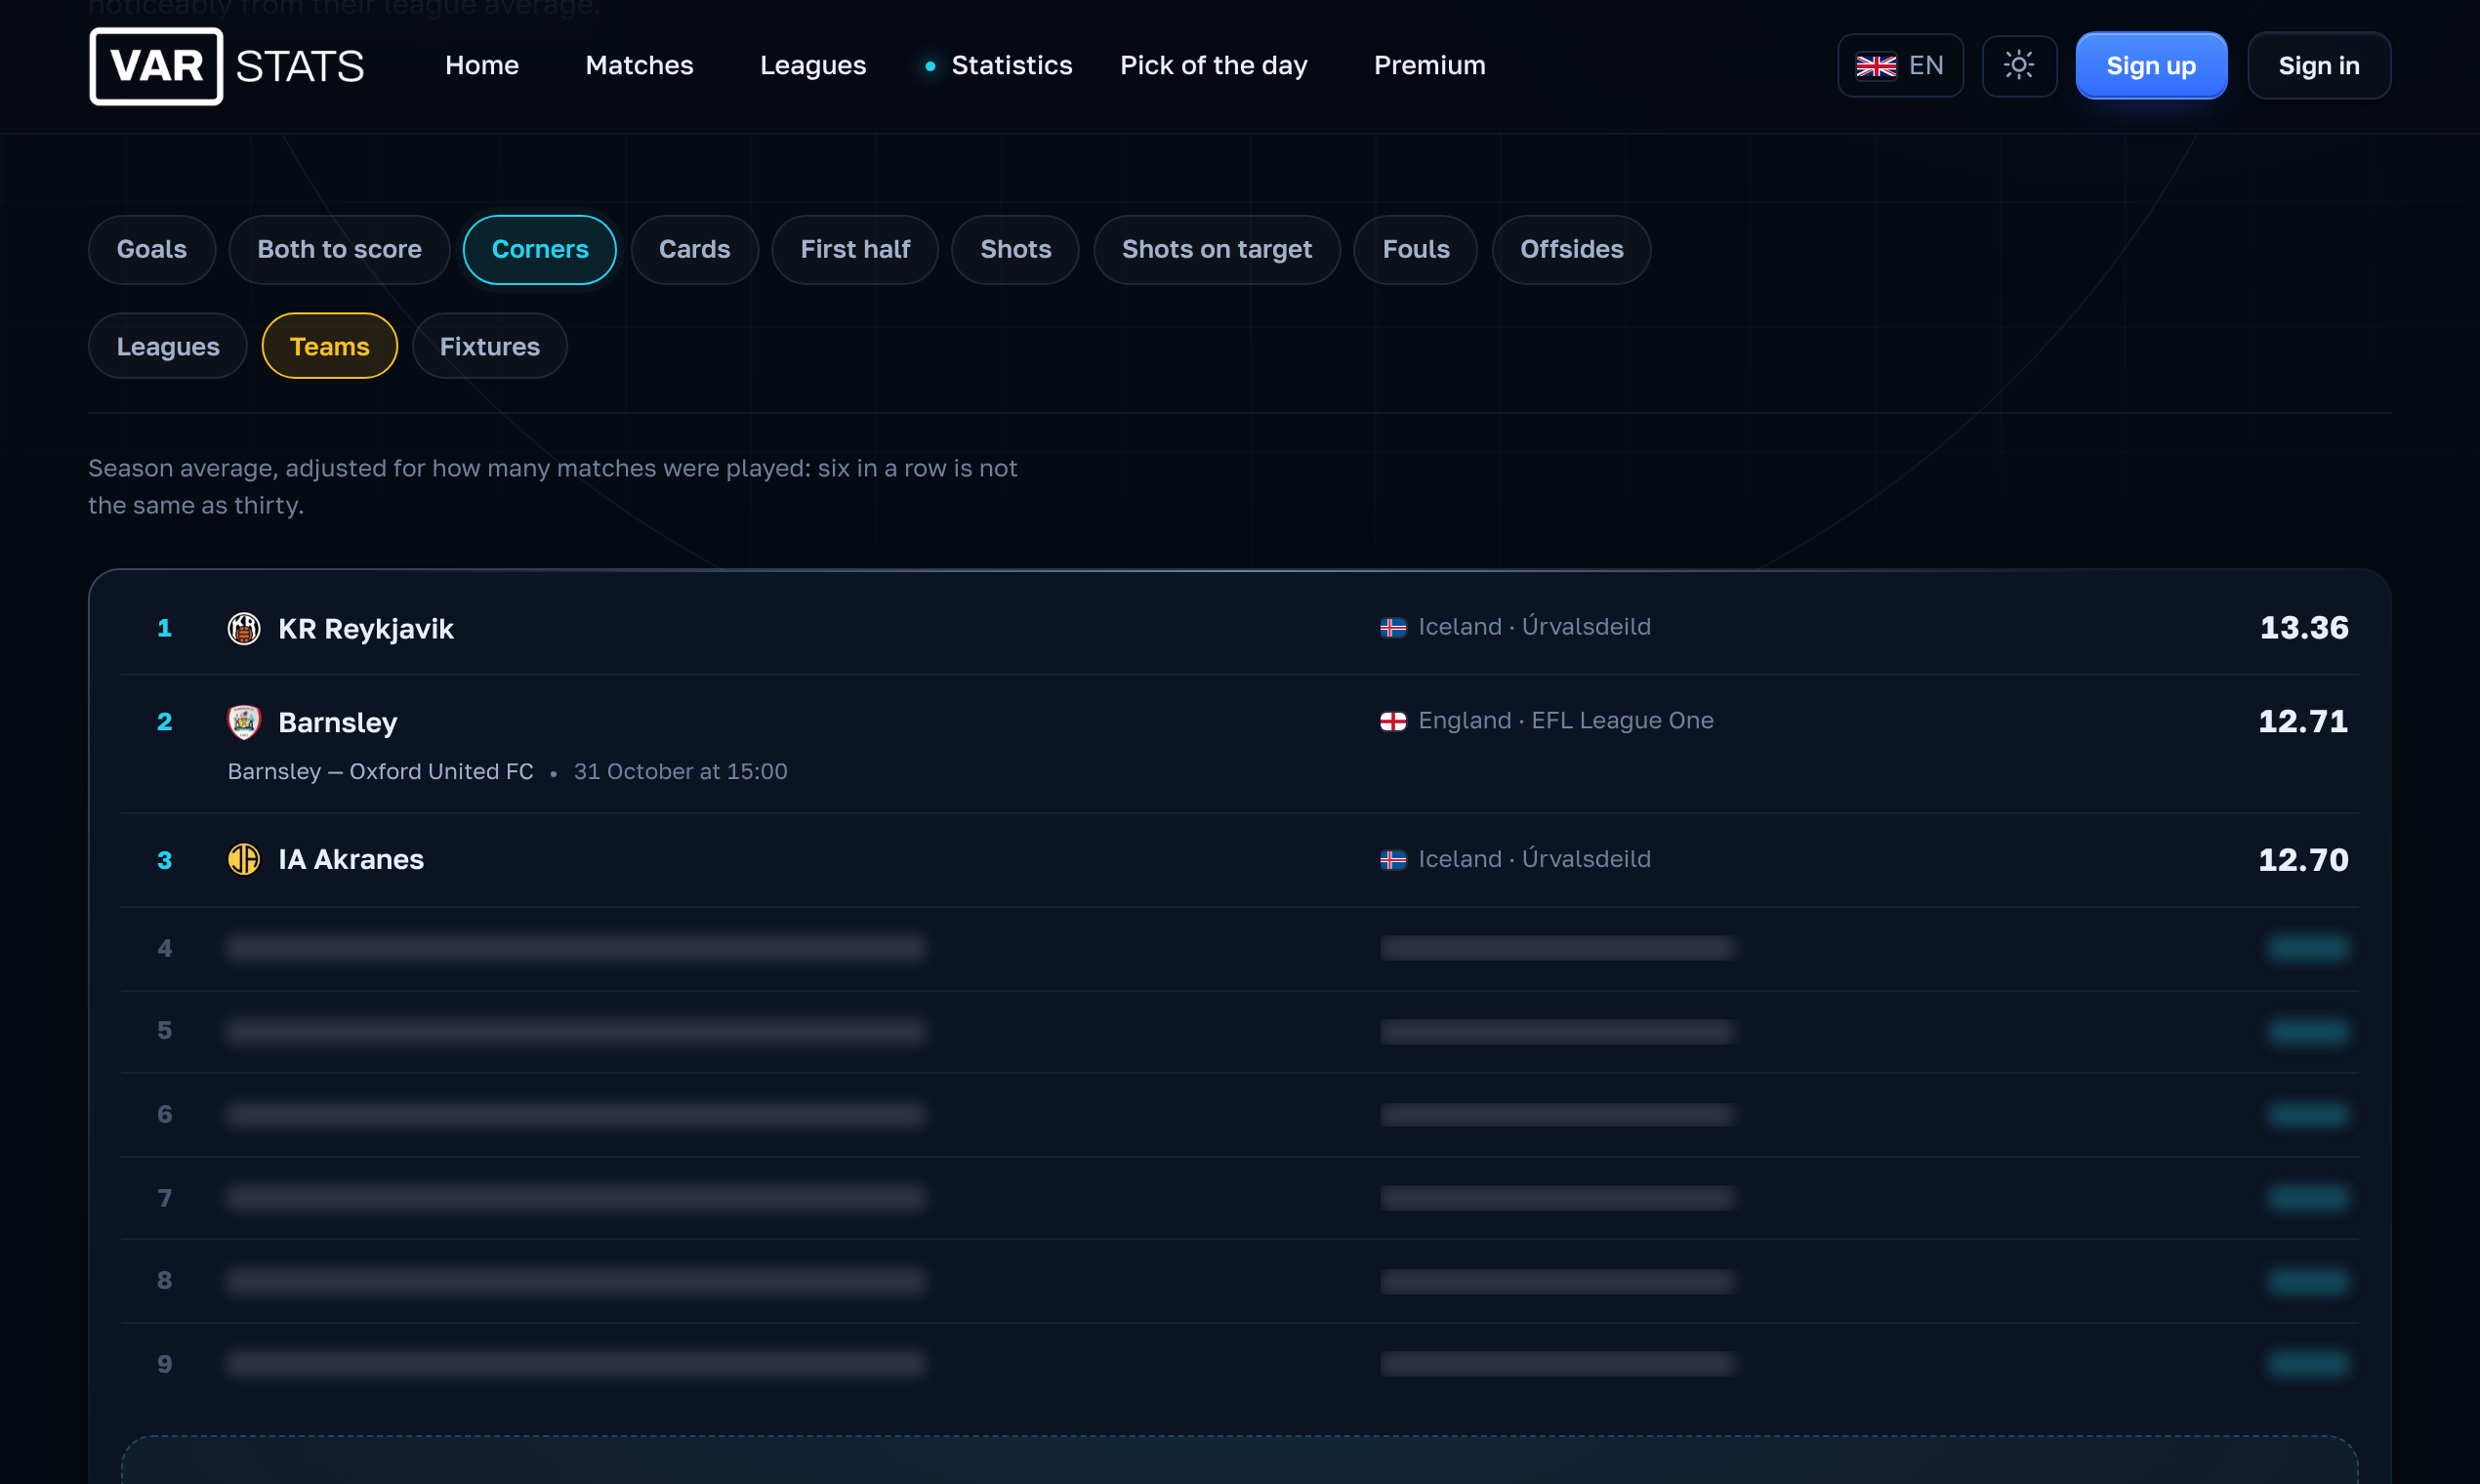
• League and team statistics: goals, corners, cards, shots, fouls, offsides
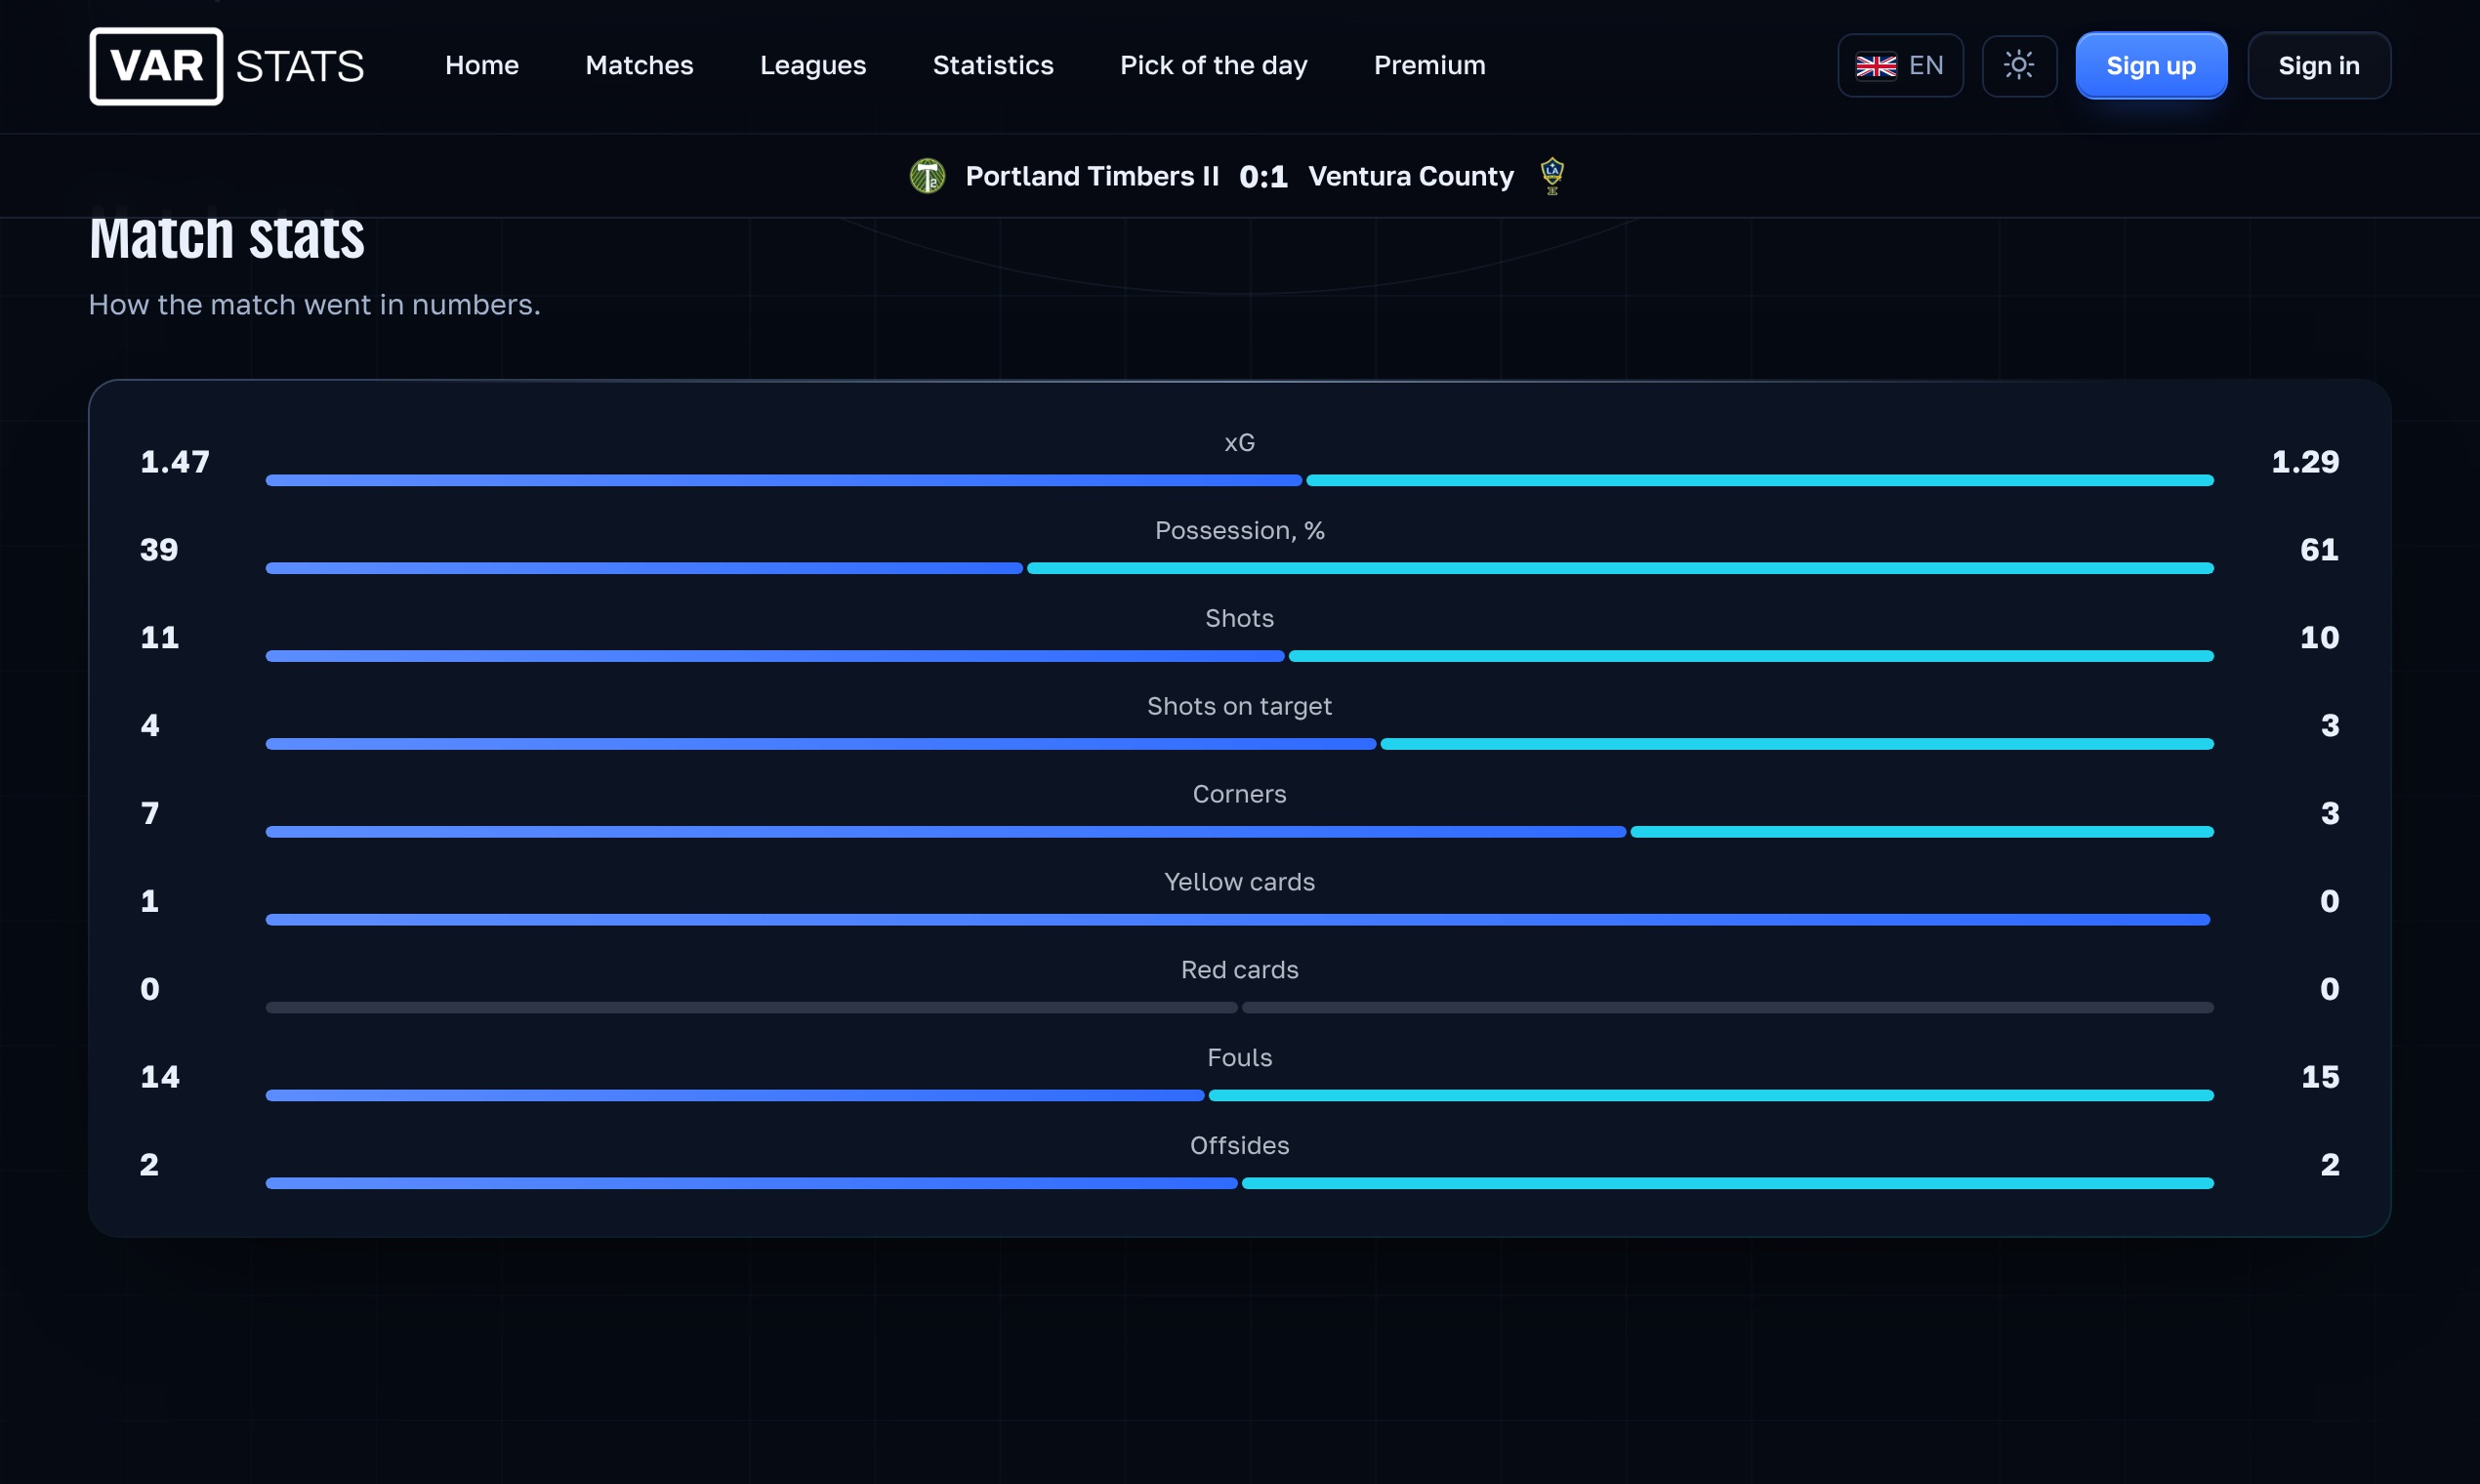
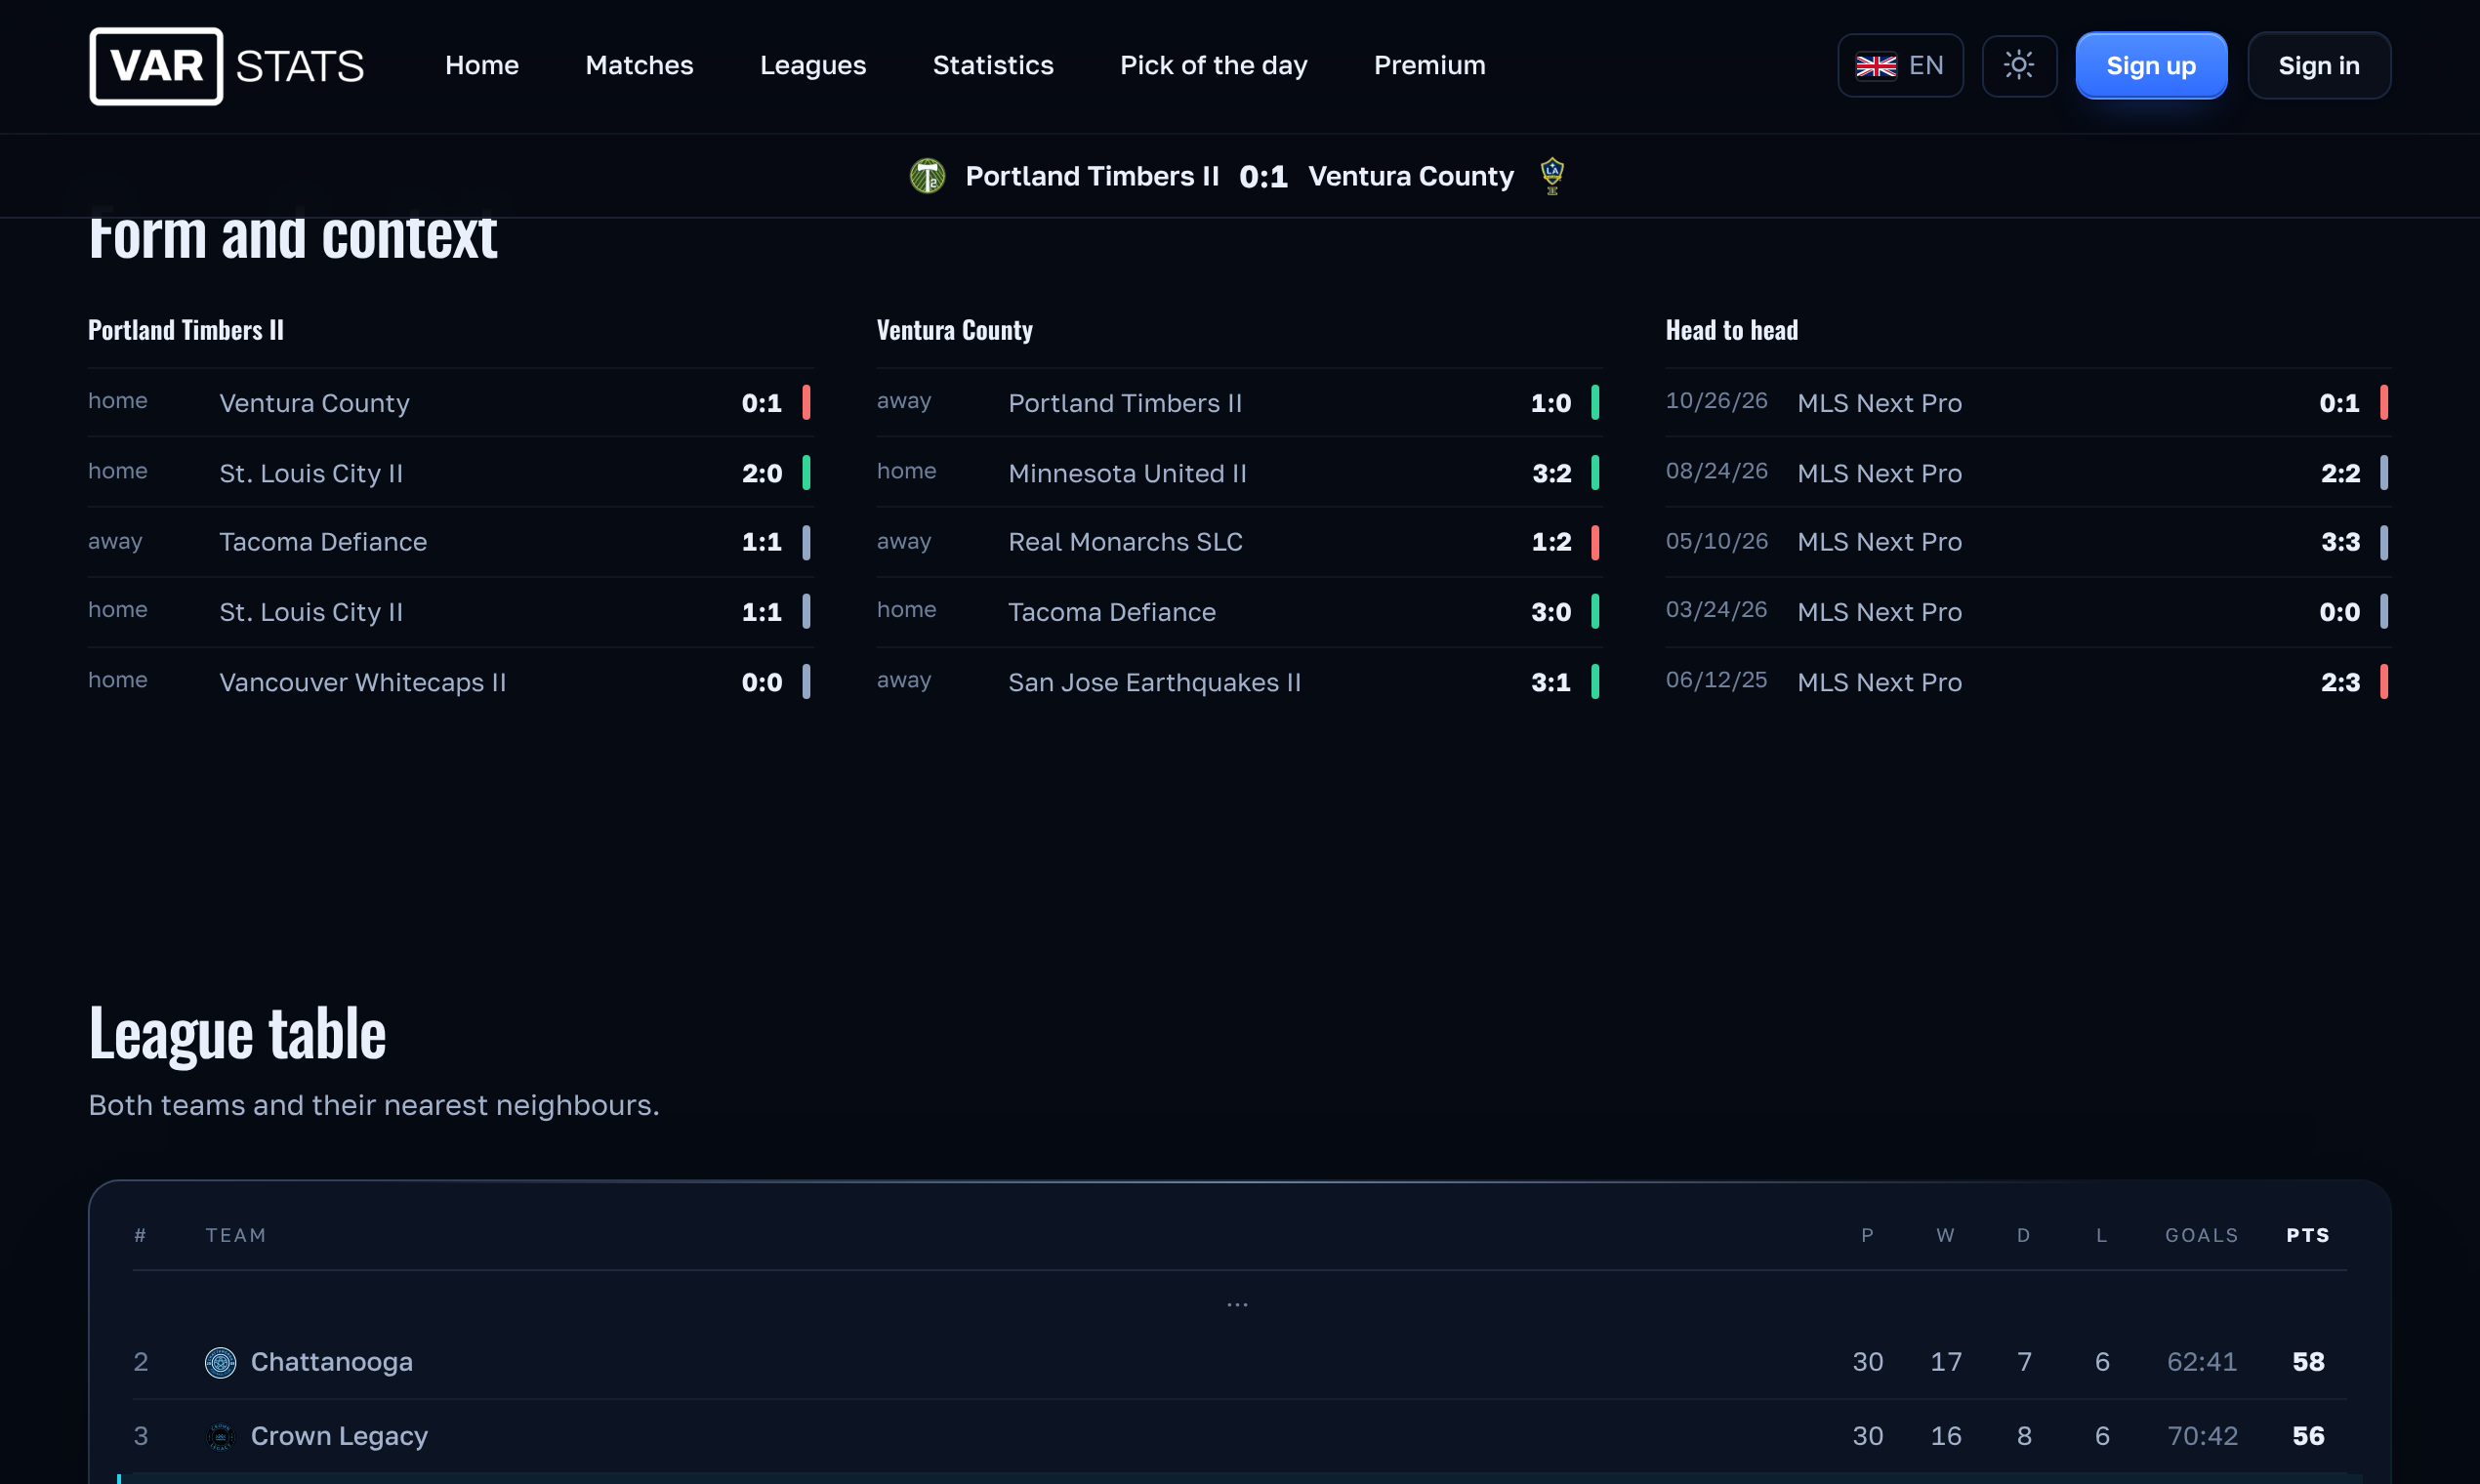
• Head-to-head, form and league table on every match page
• Favourite teams and match reminders in your own time zone
• 9 languages: English, Russian, Turkish, Uzbek, Kazakh, Spanish, German, French, Italian
• Web, Android app and Telegram bot
Use Cases
• Check how likely each result is before a match you plan to watch
• Compare leagues and teams by goals, corners, cards or shots
• See whether a team is tired: days of rest and fixture congestion
• Find out how strict the referee is before a big game
• Follow your favourite teams and get reminders in your time zone
• Prepare match previews, articles or podcasts with ready-made numbers
• Settle a debate with friends using real statistics, not opinions
• Track how often the model was right before trusting its numbers

Comments



I do social media for a Swiss football club, and the referee record plus days of rest is exactly the kind of context we look for when writing match previews. The public track record is a nice touch too. One idea for the match page: a short shareable summary card (key stats, form, referee) that people could post directly. Would that fit your roadmap?
Refreshing amount of model transparency for sports analytics - most competitors sell picks and hide the engine. Two questions from the modeling side: how stable are the Dixon-Coles estimates early in a season, when the time-decayed form window overlaps mostly with last season's games? And does the weekly calibration split by market (results vs totals vs cards)? The referee-adjusted cards market looks like the hardest one to calibrate, so the honest-record section calling out where the model over-promises is a nice touch.
VARStats sounds like a really useful tool for football fans and analysts! I especially like the https://www.maximtimeclock.online transparency behind its predictions and the detailed statistics explaining each estimate.

What stands out about VARStats is the emphasis on transparency, not just predictions. Probability models are only useful when people can understand the factors behind them and see how well they actually perform over time. I particularly like the public track record and weekly calibration approach. Combining league-specific modelling with factors like fixture congestion, xG, and referee tendencies makes the analysis more contextual. Being upfront about uncertainty rather than promising guaranteed outcomes is a refreshing approach to football analytics.

Hi Fazier! I'm Merdan, the maker of VARStats. I built it because football sites usually give you either raw stats or a single "prediction" — and never tell you how often they were right. VARStats turns match statistics into probabilities for results, goals, corners and cards across 100+ leagues, explains each number (form, rest days, fixture congestion, the referee), and keeps a public record of how many forecasts actually came through. The model is a Dixon-Coles rating fitted per league, recalibrated every week against played matches. It works on the web in 9 languages, as an Android app and as a Telegram bot. I'd love your feedback: what would make the match page more useful for you?

The public track record is what earns trust here, so two questions on how it is scored. Is it measured with something like Brier or log-loss rather than raw hit-rate? A 60 percent pick that loses is not really wrong, and calibration is the honest metric. And is the Pick of the Day tracked as its own series, so its history cannot be cherry-picked from the full set of forecasts? Last one on the model: does the referee card adjustment update mid-season as a ref's cards-per-game drifts, or is it fixed from last season?
Premium Products

















































Sponsors
Buy
Comments
I do social media for a Swiss football club, and the referee record plus days of rest is exactly the kind of context we look for when writing match previews. The public track record is a nice touch too. One idea for the match page: a short shareable summary card (key stats, form, referee) that people could post directly. Would that fit your roadmap?
Refreshing amount of model transparency for sports analytics - most competitors sell picks and hide the engine. Two questions from the modeling side: how stable are the Dixon-Coles estimates early in a season, when the time-decayed form window overlaps mostly with last season's games? And does the weekly calibration split by market (results vs totals vs cards)? The referee-adjusted cards market looks like the hardest one to calibrate, so the honest-record section calling out where the model over-promises is a nice touch.
VARStats sounds like a really useful tool for football fans and analysts! I especially like the https://www.maximtimeclock.online transparency behind its predictions and the detailed statistics explaining each estimate.
What stands out about VARStats is the emphasis on transparency, not just predictions. Probability models are only useful when people can understand the factors behind them and see how well they actually perform over time. I particularly like the public track record and weekly calibration approach. Combining league-specific modelling with factors like fixture congestion, xG, and referee tendencies makes the analysis more contextual. Being upfront about uncertainty rather than promising guaranteed outcomes is a refreshing approach to football analytics.
Hi Fazier! I'm Merdan, the maker of VARStats. I built it because football sites usually give you either raw stats or a single "prediction" — and never tell you how often they were right. VARStats turns match statistics into probabilities for results, goals, corners and cards across 100+ leagues, explains each number (form, rest days, fixture congestion, the referee), and keeps a public record of how many forecasts actually came through. The model is a Dixon-Coles rating fitted per league, recalibrated every week against played matches. It works on the web in 9 languages, as an Android app and as a Telegram bot. I'd love your feedback: what would make the match page more useful for you?
The public track record is what earns trust here, so two questions on how it is scored. Is it measured with something like Brier or log-loss rather than raw hit-rate? A 60 percent pick that loses is not really wrong, and calibration is the honest metric. And is the Pick of the Day tracked as its own series, so its history cannot be cherry-picked from the full set of forecasts? Last one on the model: does the referee card adjustment update mid-season as a ref's cards-per-game drifts, or is it fixed from last season?
Premium Products
New to Fazier?

Find your next favorite product or submit your own. Made by @FalakDigital.
Copyright ©2026. All Rights Reserved