
StatPecker
Effortless infographics, powerful insights.
StatPecker is a next-gen tool for content creators, analysts, marketers, and educators to transform raw data into engaging, interactive infographics—fast. Whether you're crafting reports, publishing articles, or presenting insights, StatPecker makes data storytelling effortless.

Features
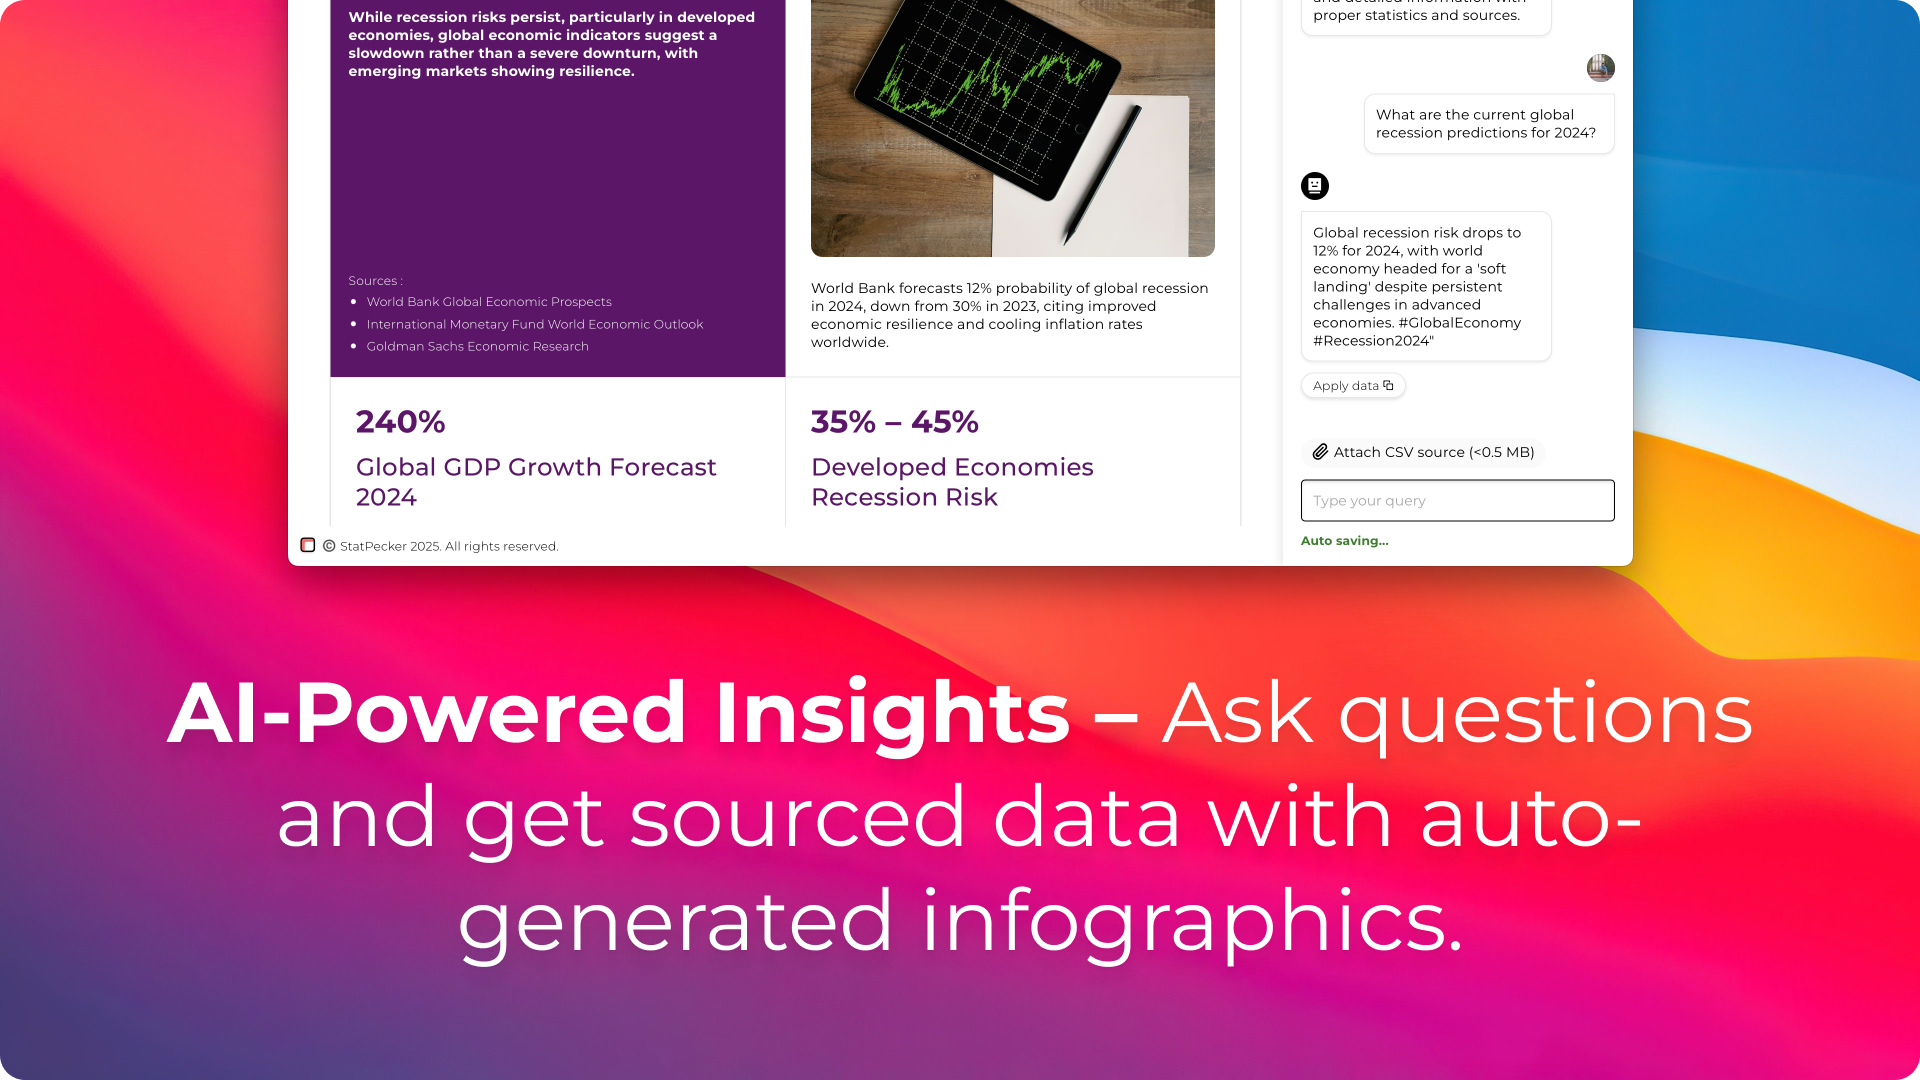
🔍 Ask Your Query – Get instant insights from validated sources using AI. No complex tools, just ask!
📊 Upload & Analyze CSVs – Extract key insights from local CSV files without the hassle of spreadsheets.
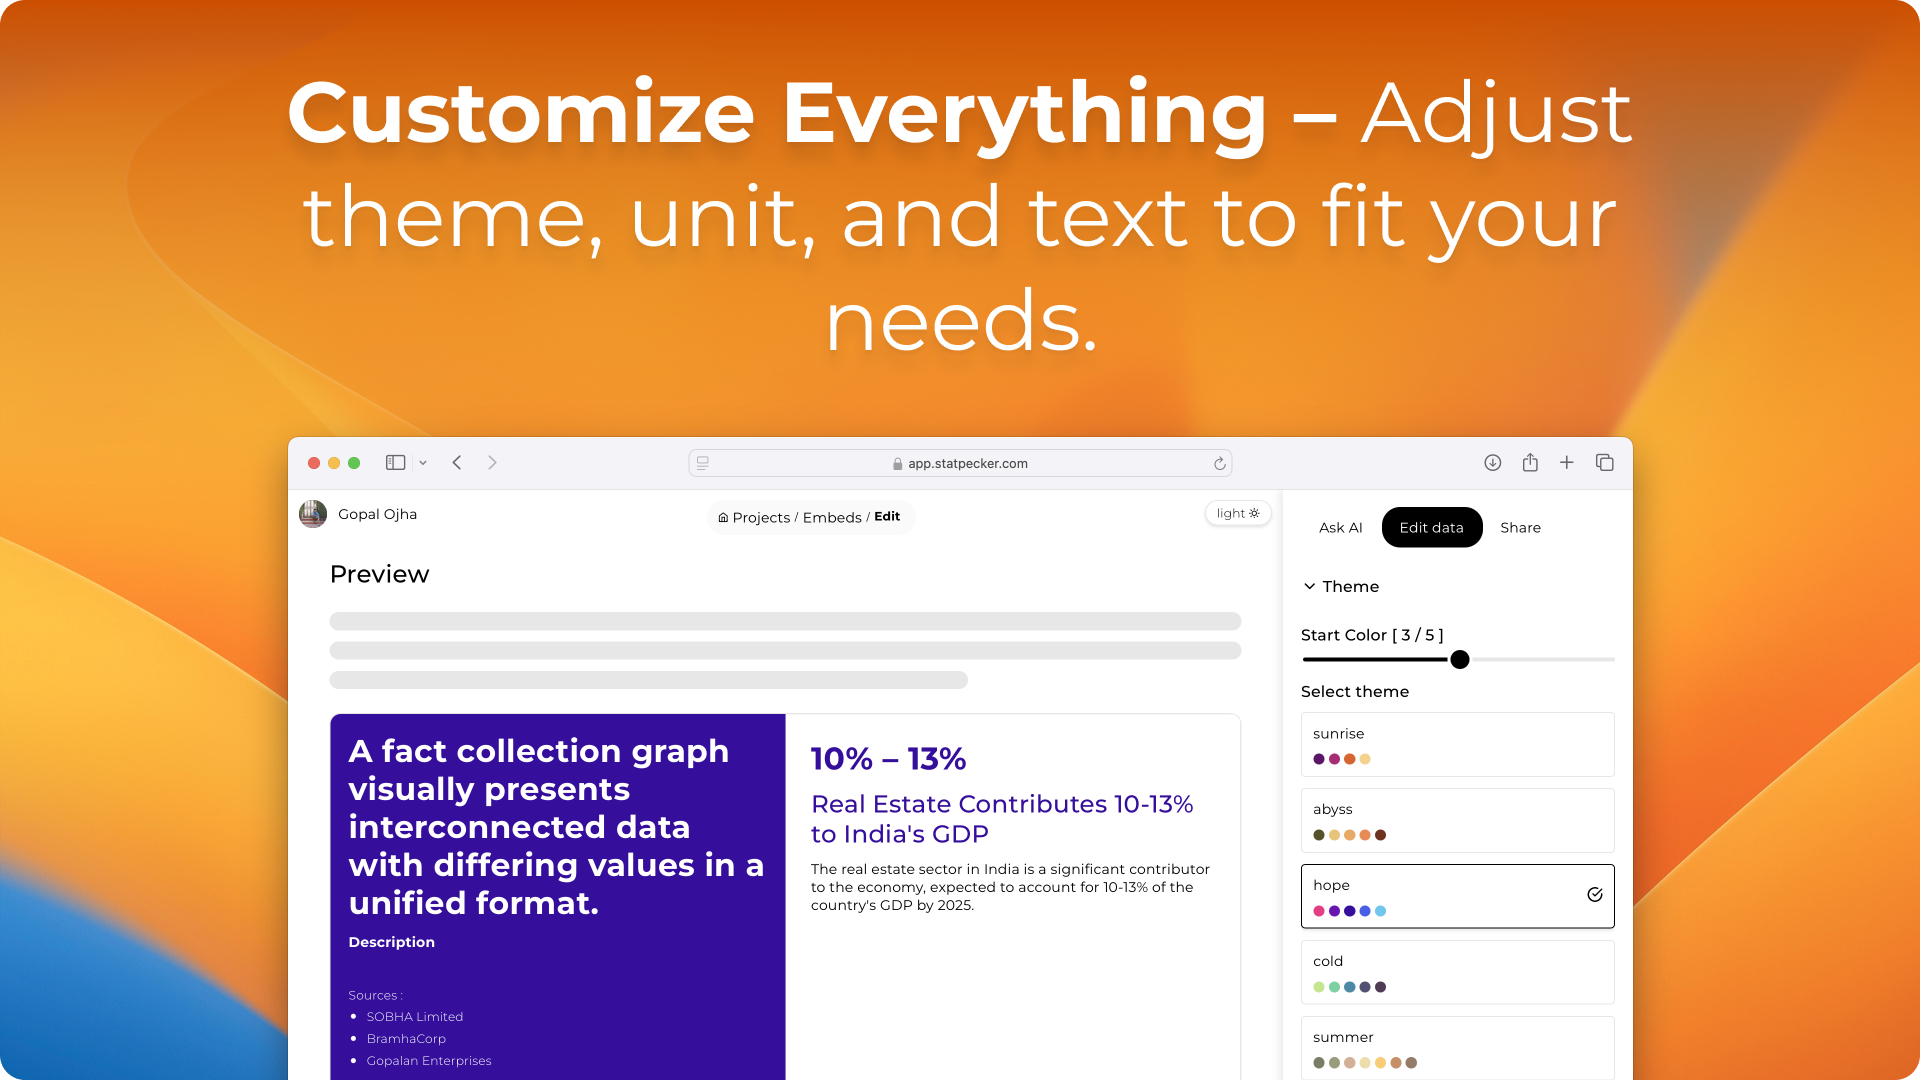
🌍 Publish & Embed – Make your visuals interactive and seamlessly integrate them into blogs, articles, and websites.
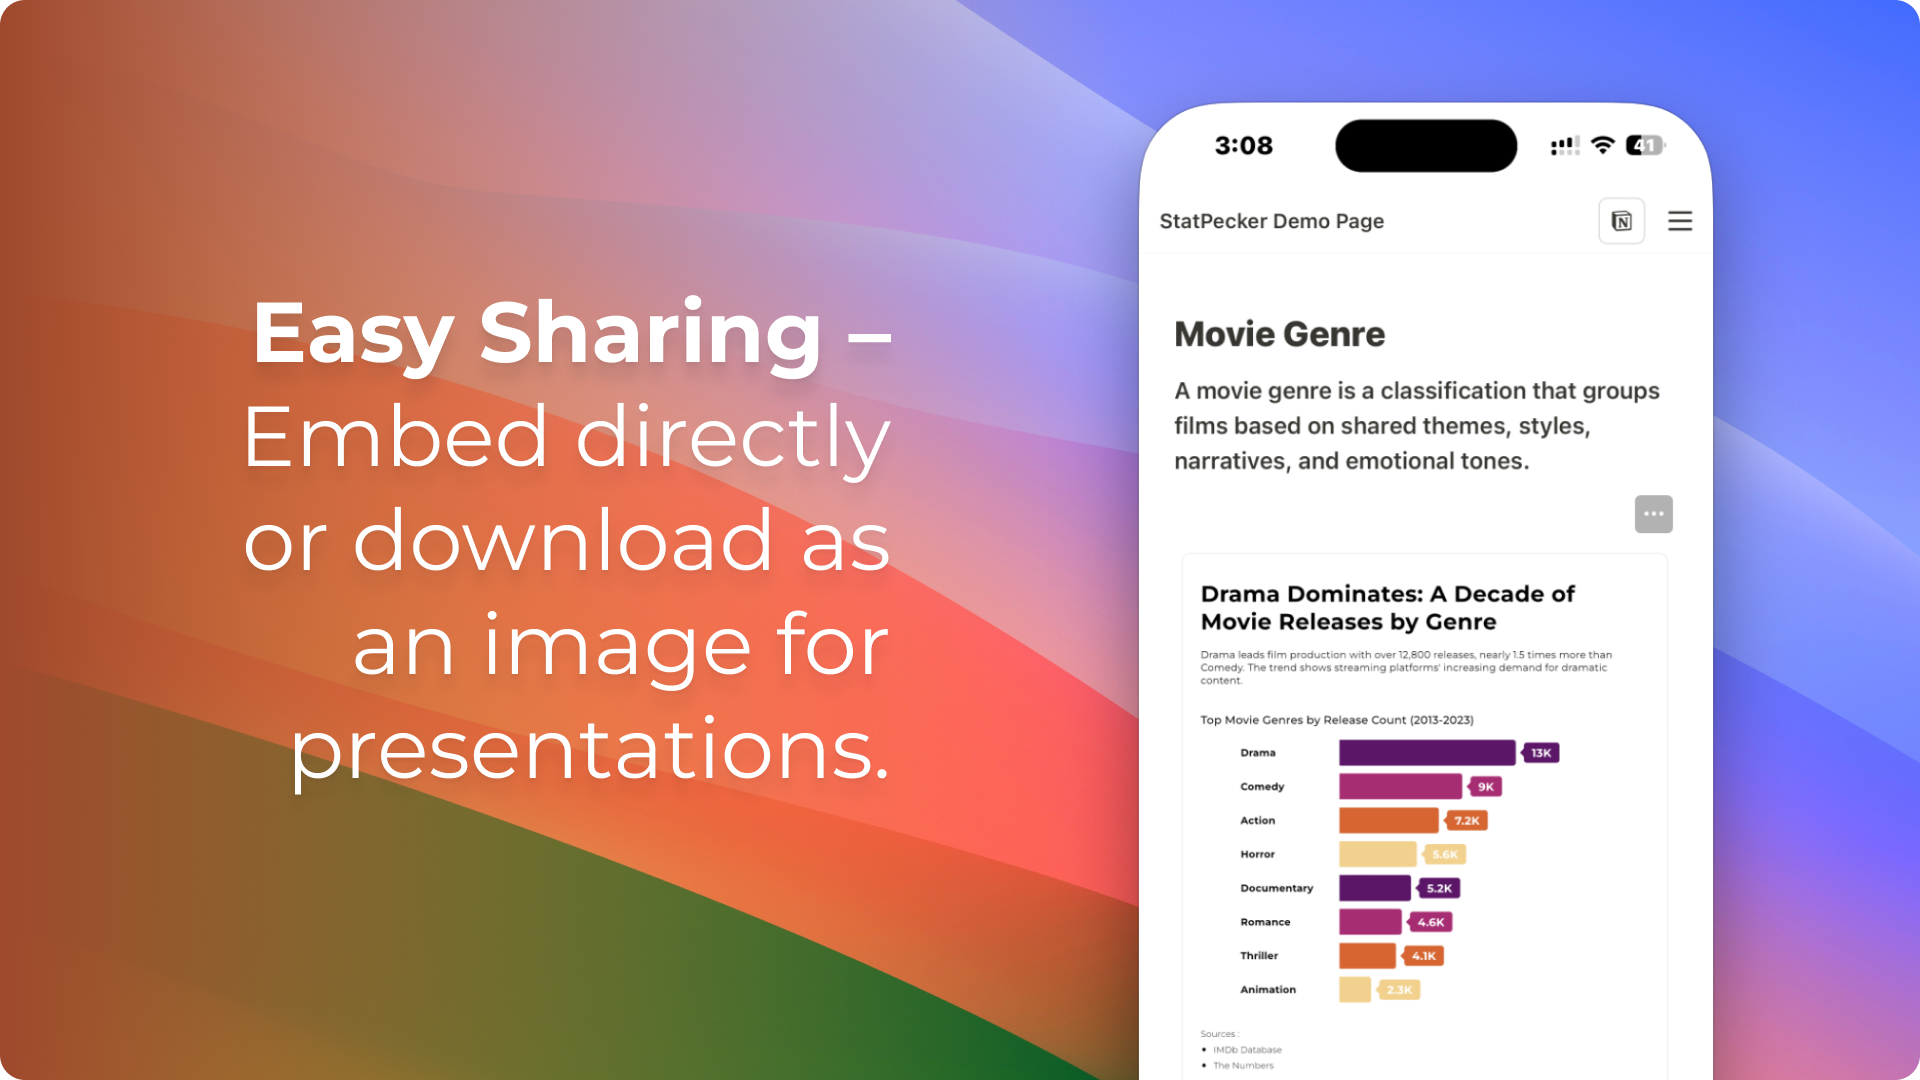
📥 Download & Use Anywhere – Export infographics as images for reports, presentations, and more.
Use Cases
📢 Content Creators & Journalists – Enrich articles with data-driven visuals for better engagement.
📊 Data Analysts & Researchers – Quickly analyze and visualize CSV data without complex tools.
📈 Marketers & Businesses – Enhance reports, presentations, and campaigns with compelling infographics.
🎓 Educators & Students – Simplify complex concepts with clear, interactive visualizations.

Comments


StatPecker turns raw CSVs into visual stories in seconds. I upload a dataset, ask a plain-English question, and it spits out polished infographics with ready-to-embed codes—no spreadsheets, no BI dashboards needed. The generous free tier and instant PNG downloads save me hours. I only wish it handled multi-table joins, but for fast, shareable data storytelling it’s a winner.
Premium Products


Sponsors
BuyAwards
View all
Awards
View allMakers
Makers
Comments
StatPecker turns raw CSVs into visual stories in seconds. I upload a dataset, ask a plain-English question, and it spits out polished infographics with ready-to-embed codes—no spreadsheets, no BI dashboards needed. The generous free tier and instant PNG downloads save me hours. I only wish it handled multi-table joins, but for fast, shareable data storytelling it’s a winner.
Premium Products
New to Fazier?

Find your next favorite product or submit your own. Made by @FalakDigital.
Copyright ©2025. All Rights Reserved