
Snipowl
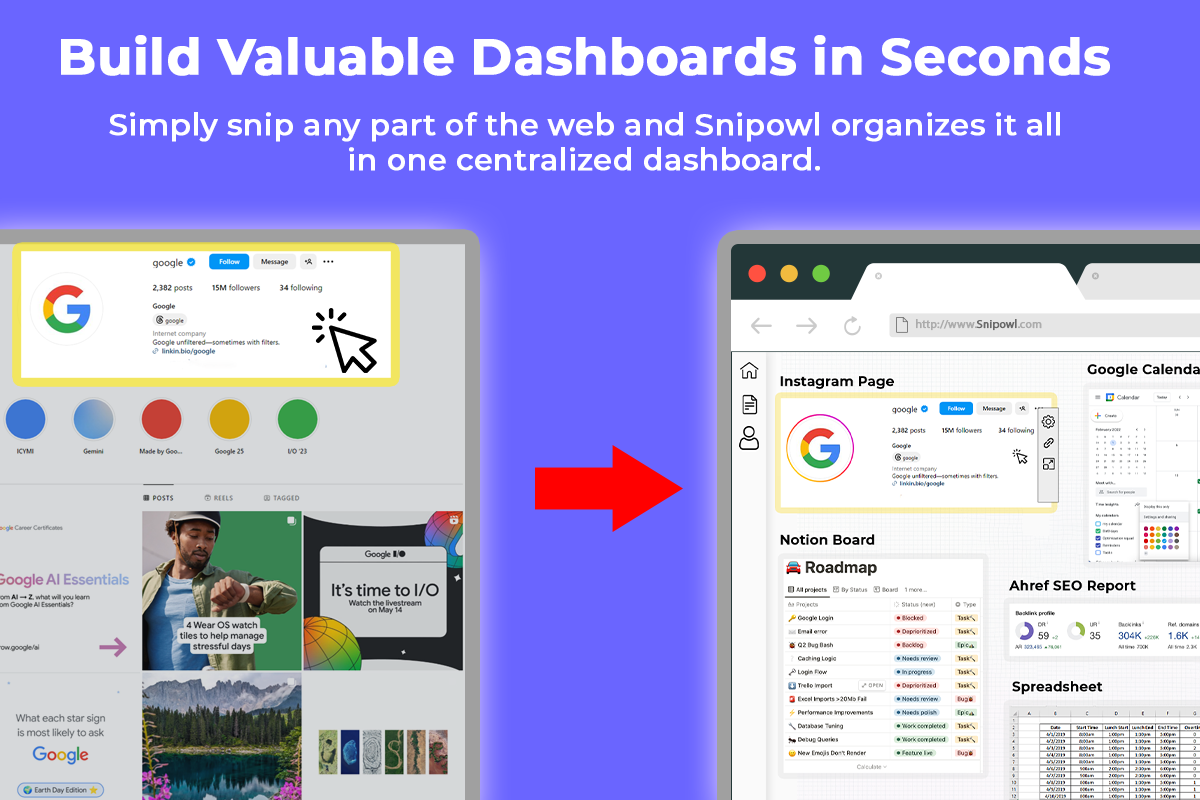
Build custom dashboards with live snapshots
SnipOwl gives you the power to combine any website or apps and build live dashboards in seconds - without traditional integrations.
Imagine centralizing all your important data with live snapshots and having it in one intuitive dashboard to track easily.
Snips are not just screenshots, they refresh/update and it even works with sites that require logins.
Try SnipOwl now


Features
Fast Captures
- Simply snip and build live dashboards in seconds
Track & analyze
- Have a centralized view over all your data and stay informed
Ditch integrations
- Get unlimited connections without integrations or API keys and select what you need.
Streamline your workspace
- Eliminate the hassle of switching between tabs and enjoy seamless access to data.
See your data live
- Each snip is a live feed, ensuring you're never out of sync with the latest updates.
Share or embed
- Share your data insights easily: Embed a dashboard or any website or app!
Use Cases
Research and Development Dashboards
- Track progress on R&D projects, monitor key milestones, and analyze research data
- Consolidate snapshots from project management tools, data visualization software, and scientific databases
Executive Dashboards
- Gain a high-level overview of the organization's performance, including financial, sales, and operational data
- Integrate snapshots from various business intelligence and reporting tools
IT Dashboards
- Monitor network performance, cybersecurity threats, IT support tickets, and infrastructure health
- Consolidate snapshots from network monitoring tools, security platforms, and IT service management software
Real Estate Dashboards
- Track property listings, occupancy rates, rental income, and market trends
- Integrate snapshots from real estate management software, market analysis tools, and portfolio tracking systems
Personal Productivity Dashboards
- Track time spent on tasks, daily schedule, to-do lists, and key productivity metrics
- Combine snapshots from calendar, task management, and note-taking apps
Marketing Campaign Dashboards
- Monitor real-time campaign performance data, such as website traffic, lead generation, and social media engagement
- Consolidate snapshots from analytics tools, marketing automation platforms, and social media
Sales Pipeline Dashboards
- Visualize the sales funnel, track deal stages, monitor key sales metrics, and identify opportunities
- Integrate snapshots from CRM, sales forecasting, and lead management tools
Project Management Dashboards
- Overview of project timelines, task progress, team workloads, and resource allocation
- Combine snapshots from project management software, task boards, and team collaboration tools
Financial Dashboards
- Monitor cash flow, revenue, expenses, and other financial KPIs
- Incorporate snapshots from accounting software, invoicing tools, and financial reporting systems
Customer Support Dashboards
- Analyze customer tickets, response times, customer satisfaction, and other support metrics
- Integrate snapshots from help desk software, customer feedback platforms, and CRM
Content Marketing Dashboards
- Monitor web traffic, social media engagement, lead generation, and content performance
- Combine snapshots from web analytics, social media management, and content management tools

Comments

Premium Products


Find your next favorite product or submit your own. Made by @FalakDigital.
Copyright ©2025. All Rights Reserved