
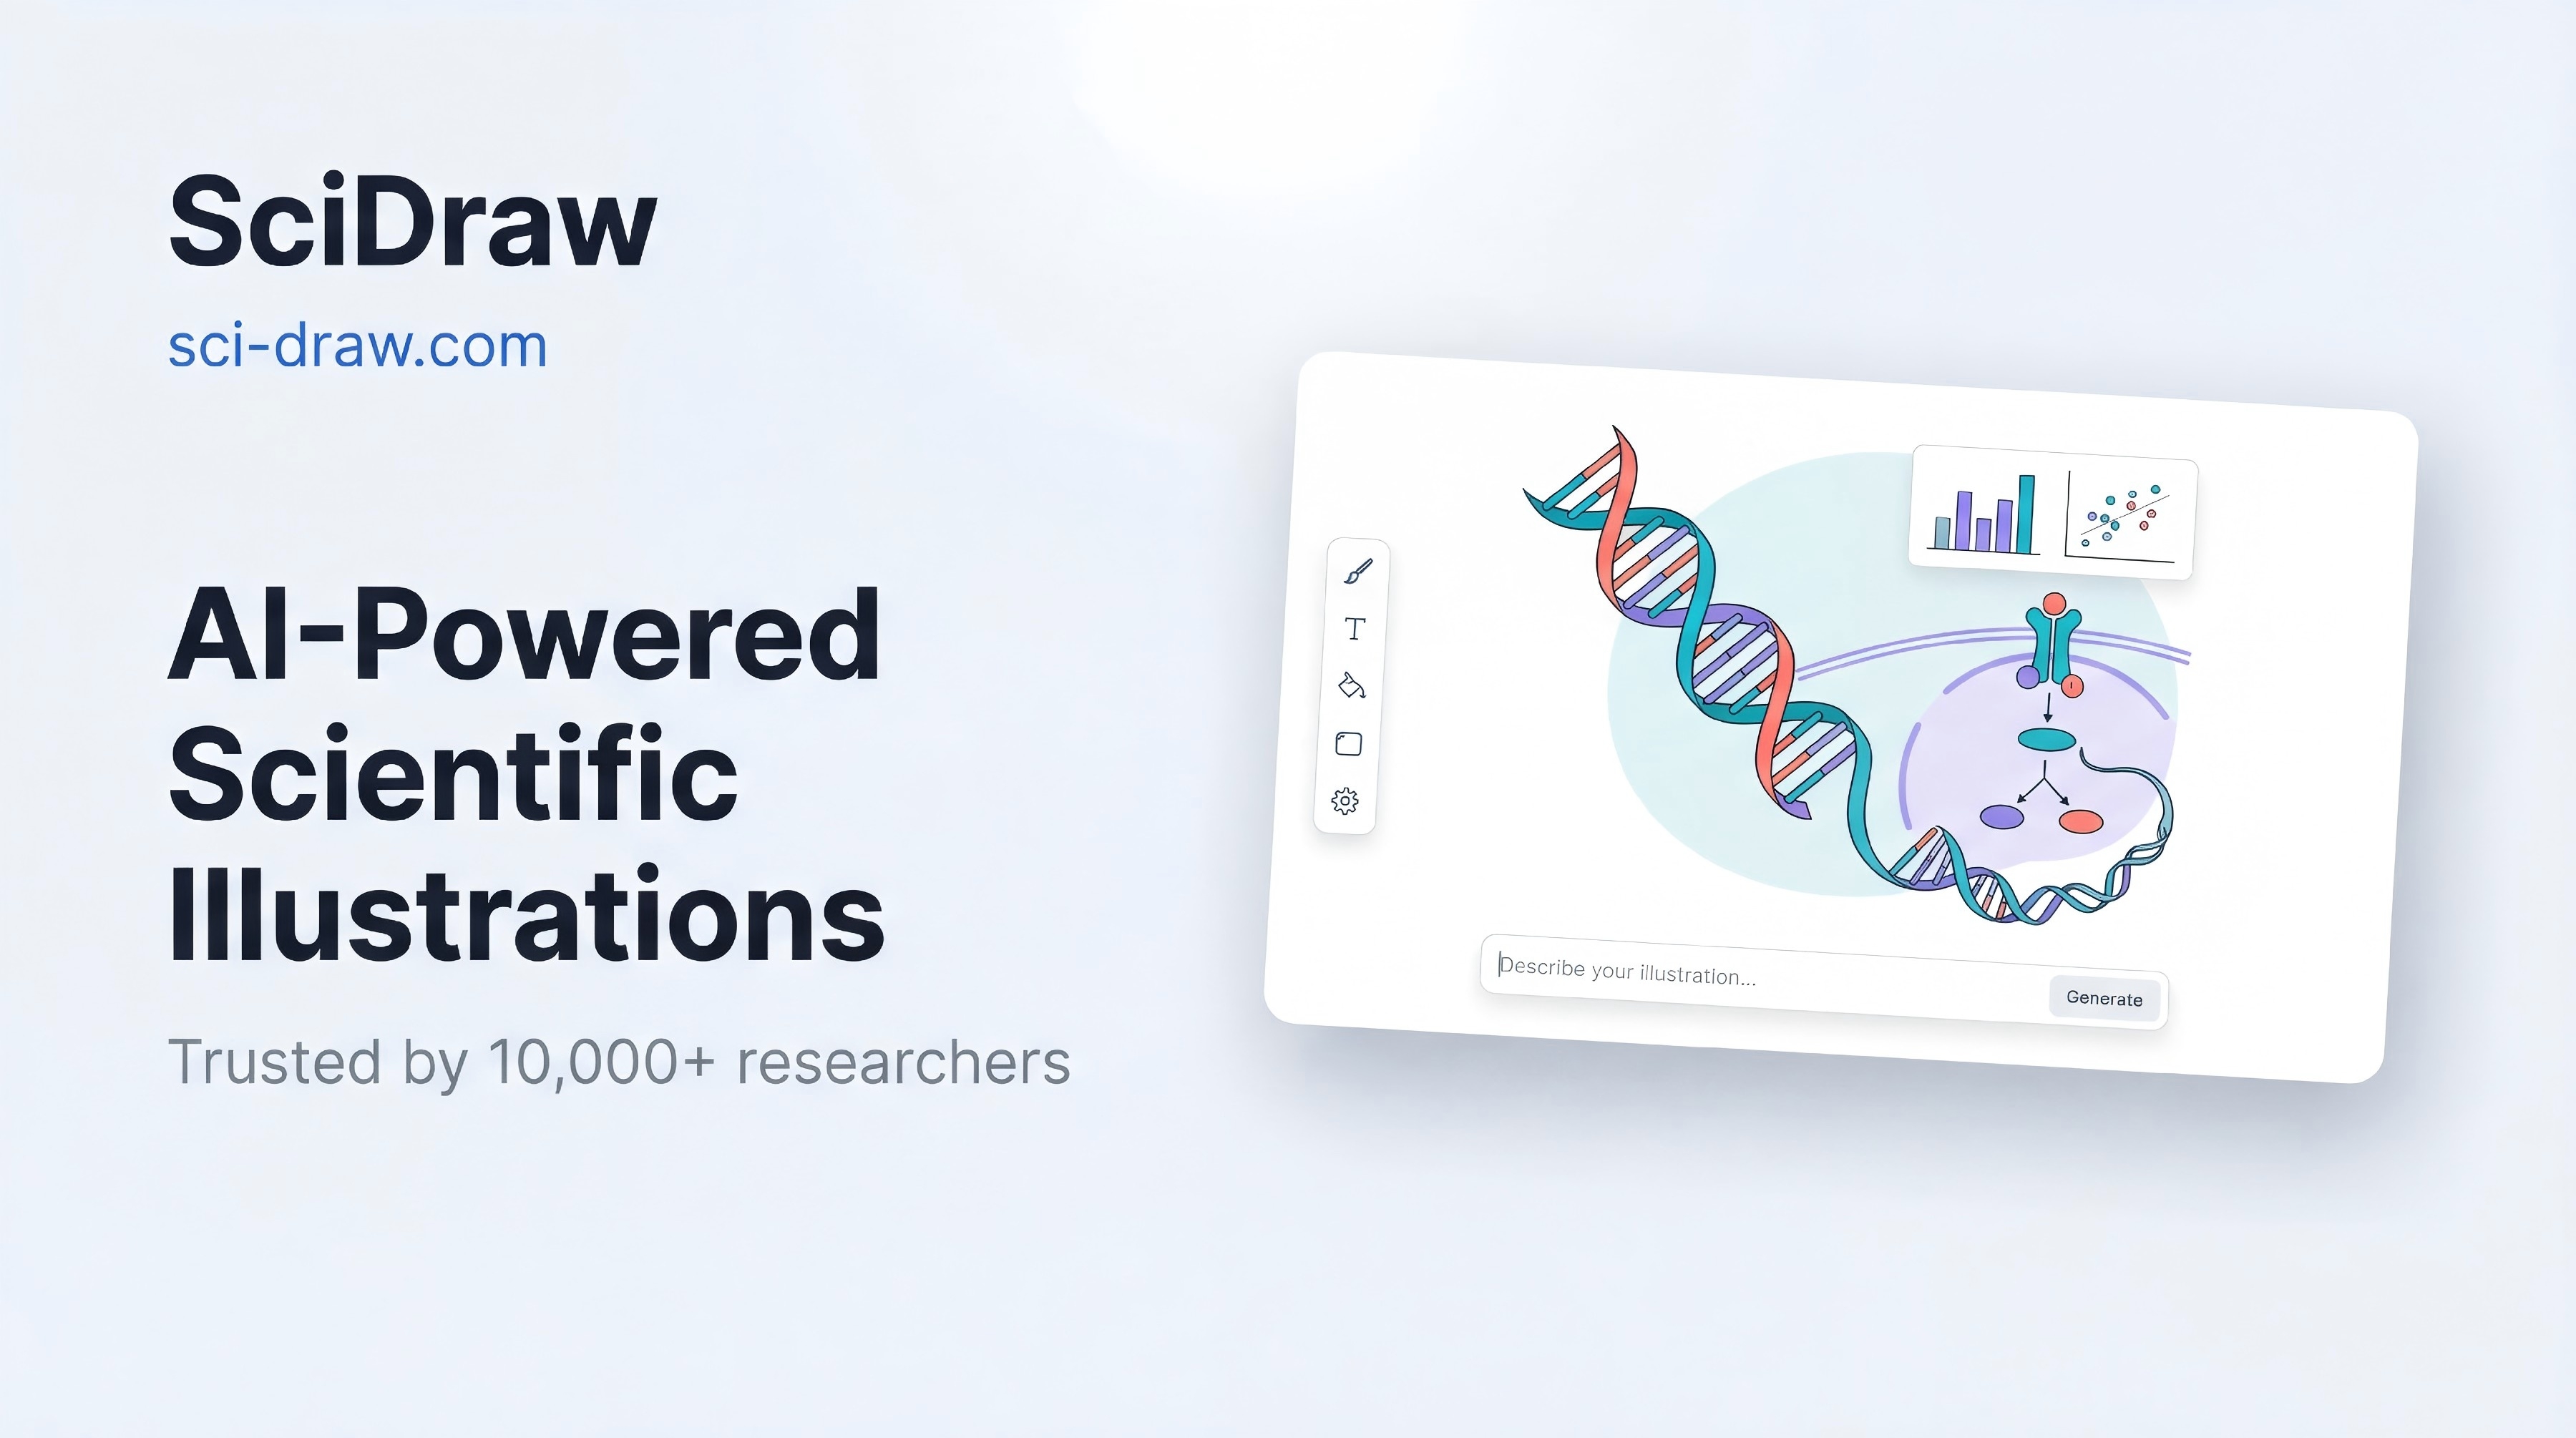
SciDraw
AI Scientific Graphics Platform
SciDraw is an AI-powered scientific illustration and data visualization platform built for researchers, academics, and science communicators. It combines text-to-figure generation with chart creation tools, all optimized for academic submission standards. Trusted by 10,000+ researchers worldwide, SciDraw generates publication-ready figures in 3–5 minutes — saving up to 90% of traditional drawing time — at less than $0.50 per image.
Features
Text-to-Illustration — Describe your concept in natural language and get a publication-ready scientific figure in 3–10 seconds
Sketch-to-Figure — Upload hand-drawn sketches or reference images; AI transforms them into polished visuals through multi-round dialog optimization
Data Visualization — Import CSV or Excel files directly to generate journal-quality charts: box plots, heatmaps, regression charts, scatter plots, and more
Academic Color Palettes & Formatting — Built-in compliance with top SCI journal standards, including color schemes and layout conventions
Multi-Round AI Refinement — Iteratively refine figures through conversational prompts until they match your exact intent
Professional Export — SVG, PNG, PDF, EPS, and TIFF formats covering all major journal submission requirements
Credit-Based Flexible Pricing — Pay-as-you-go system; free tier included with monthly credits, no wasted spend
Permanent History & Templates — Paid plans retain full generation history and provide access to curated scientific templates
Use Cases
Researchers creating graphical abstracts, TOC graphics, and journal cover submissions
PhD students and postdocs preparing figures for paper submissions without design skills
Academic labs producing consistent, branded scientific visuals across publications
Science educators building clear diagrams and visual aids for lectures and course materials
Science communicators and journal editors visualizing complex mechanisms for broader audiences
Biotech and pharma teams generating pathway diagrams, experimental workflow schematics, and mechanism illustrations

Comments


Maker's Comment Hey TinyLaunch community! 👋 SciDraw started with a simple observation: researchers are incredible at science, but terrible at being forced to also become graphic designers. I kept seeing the same pain point — a PhD student spends weeks on groundbreaking research, then loses days wrestling with Illustrator or PowerPoint trying to make a figure that looks professional enough for journal submission. Or they pay a designer who doesn't understand the science and gets the biology wrong. It's a tax on research productivity that nobody talks about. The existing tools didn't fully solve it. BioRender is icon-based and subscription-expensive. Generic AI image generators produce pretty pictures that aren't scientifically accurate. Nothing combined true AI generation with data visualization in one workflow built specifically for academic standards. So I built SciDraw — text in, publication-ready figure out. Describe your experimental workflow, your molecular mechanism, your data — and get a compliant, accurate visual in minutes. Upload your CSV and get a journal-quality chart. Iterate conversationally until it's exactly right. We're now trusted by 10,000+ researchers at institutions like Stanford, MIT, and Harvard. Still a lean, solo-run operation, which means I'm deeply involved in every piece of user feedback. If you're in academia or research — I'd genuinely love to hear what your biggest figure frustration is. What would make SciDraw a no-brainer for your lab? 🔬
Premium Products


Sponsors
BuyComments
Maker's Comment Hey TinyLaunch community! 👋 SciDraw started with a simple observation: researchers are incredible at science, but terrible at being forced to also become graphic designers. I kept seeing the same pain point — a PhD student spends weeks on groundbreaking research, then loses days wrestling with Illustrator or PowerPoint trying to make a figure that looks professional enough for journal submission. Or they pay a designer who doesn't understand the science and gets the biology wrong. It's a tax on research productivity that nobody talks about. The existing tools didn't fully solve it. BioRender is icon-based and subscription-expensive. Generic AI image generators produce pretty pictures that aren't scientifically accurate. Nothing combined true AI generation with data visualization in one workflow built specifically for academic standards. So I built SciDraw — text in, publication-ready figure out. Describe your experimental workflow, your molecular mechanism, your data — and get a compliant, accurate visual in minutes. Upload your CSV and get a journal-quality chart. Iterate conversationally until it's exactly right. We're now trusted by 10,000+ researchers at institutions like Stanford, MIT, and Harvard. Still a lean, solo-run operation, which means I'm deeply involved in every piece of user feedback. If you're in academia or research — I'd genuinely love to hear what your biggest figure frustration is. What would make SciDraw a no-brainer for your lab? 🔬
Premium Products
New to Fazier?

Find your next favorite product or submit your own. Made by @FalakDigital.
Copyright ©2025. All Rights Reserved