
RRG Chart
Free Relative Rotation Graph analysis tool
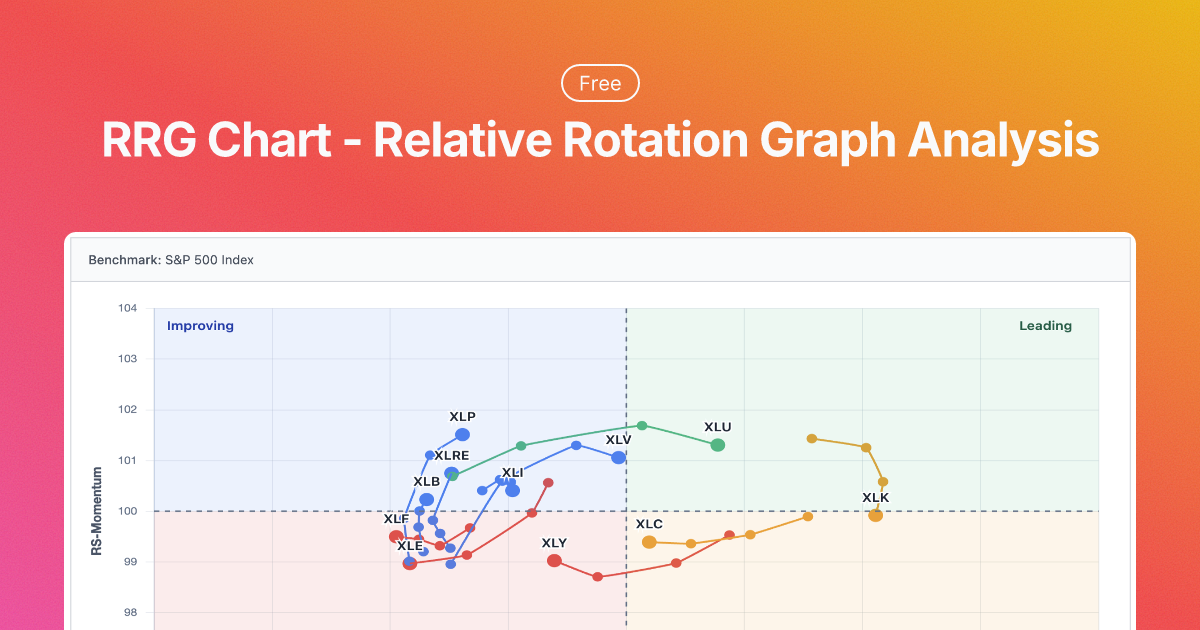
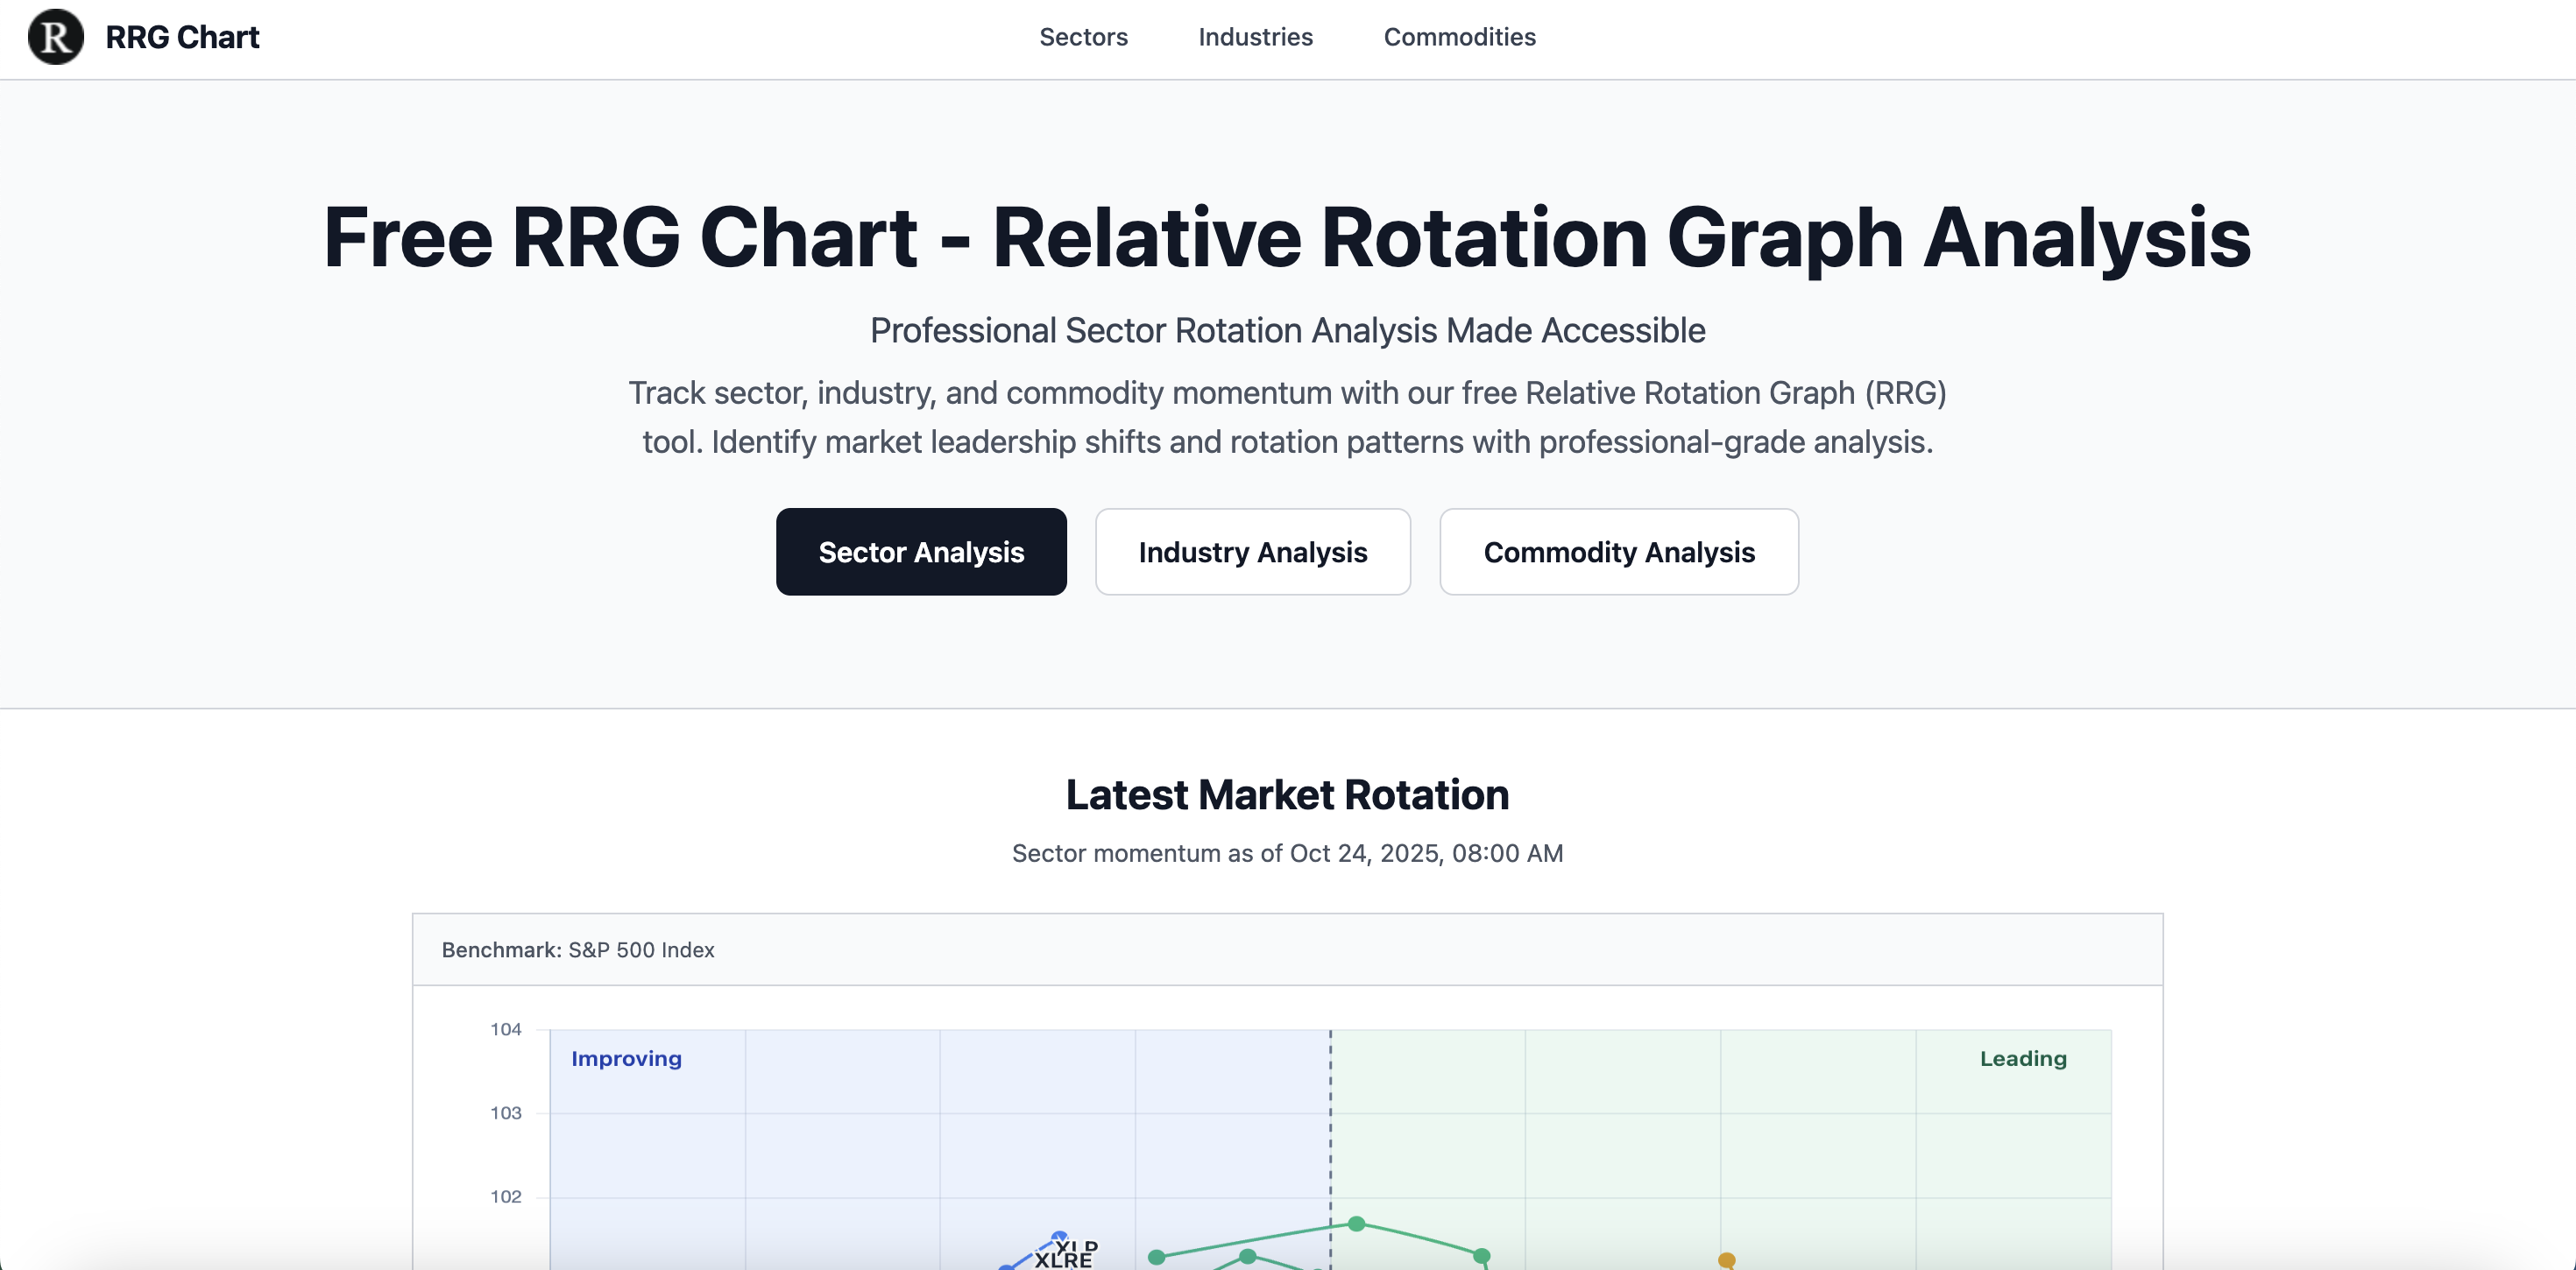
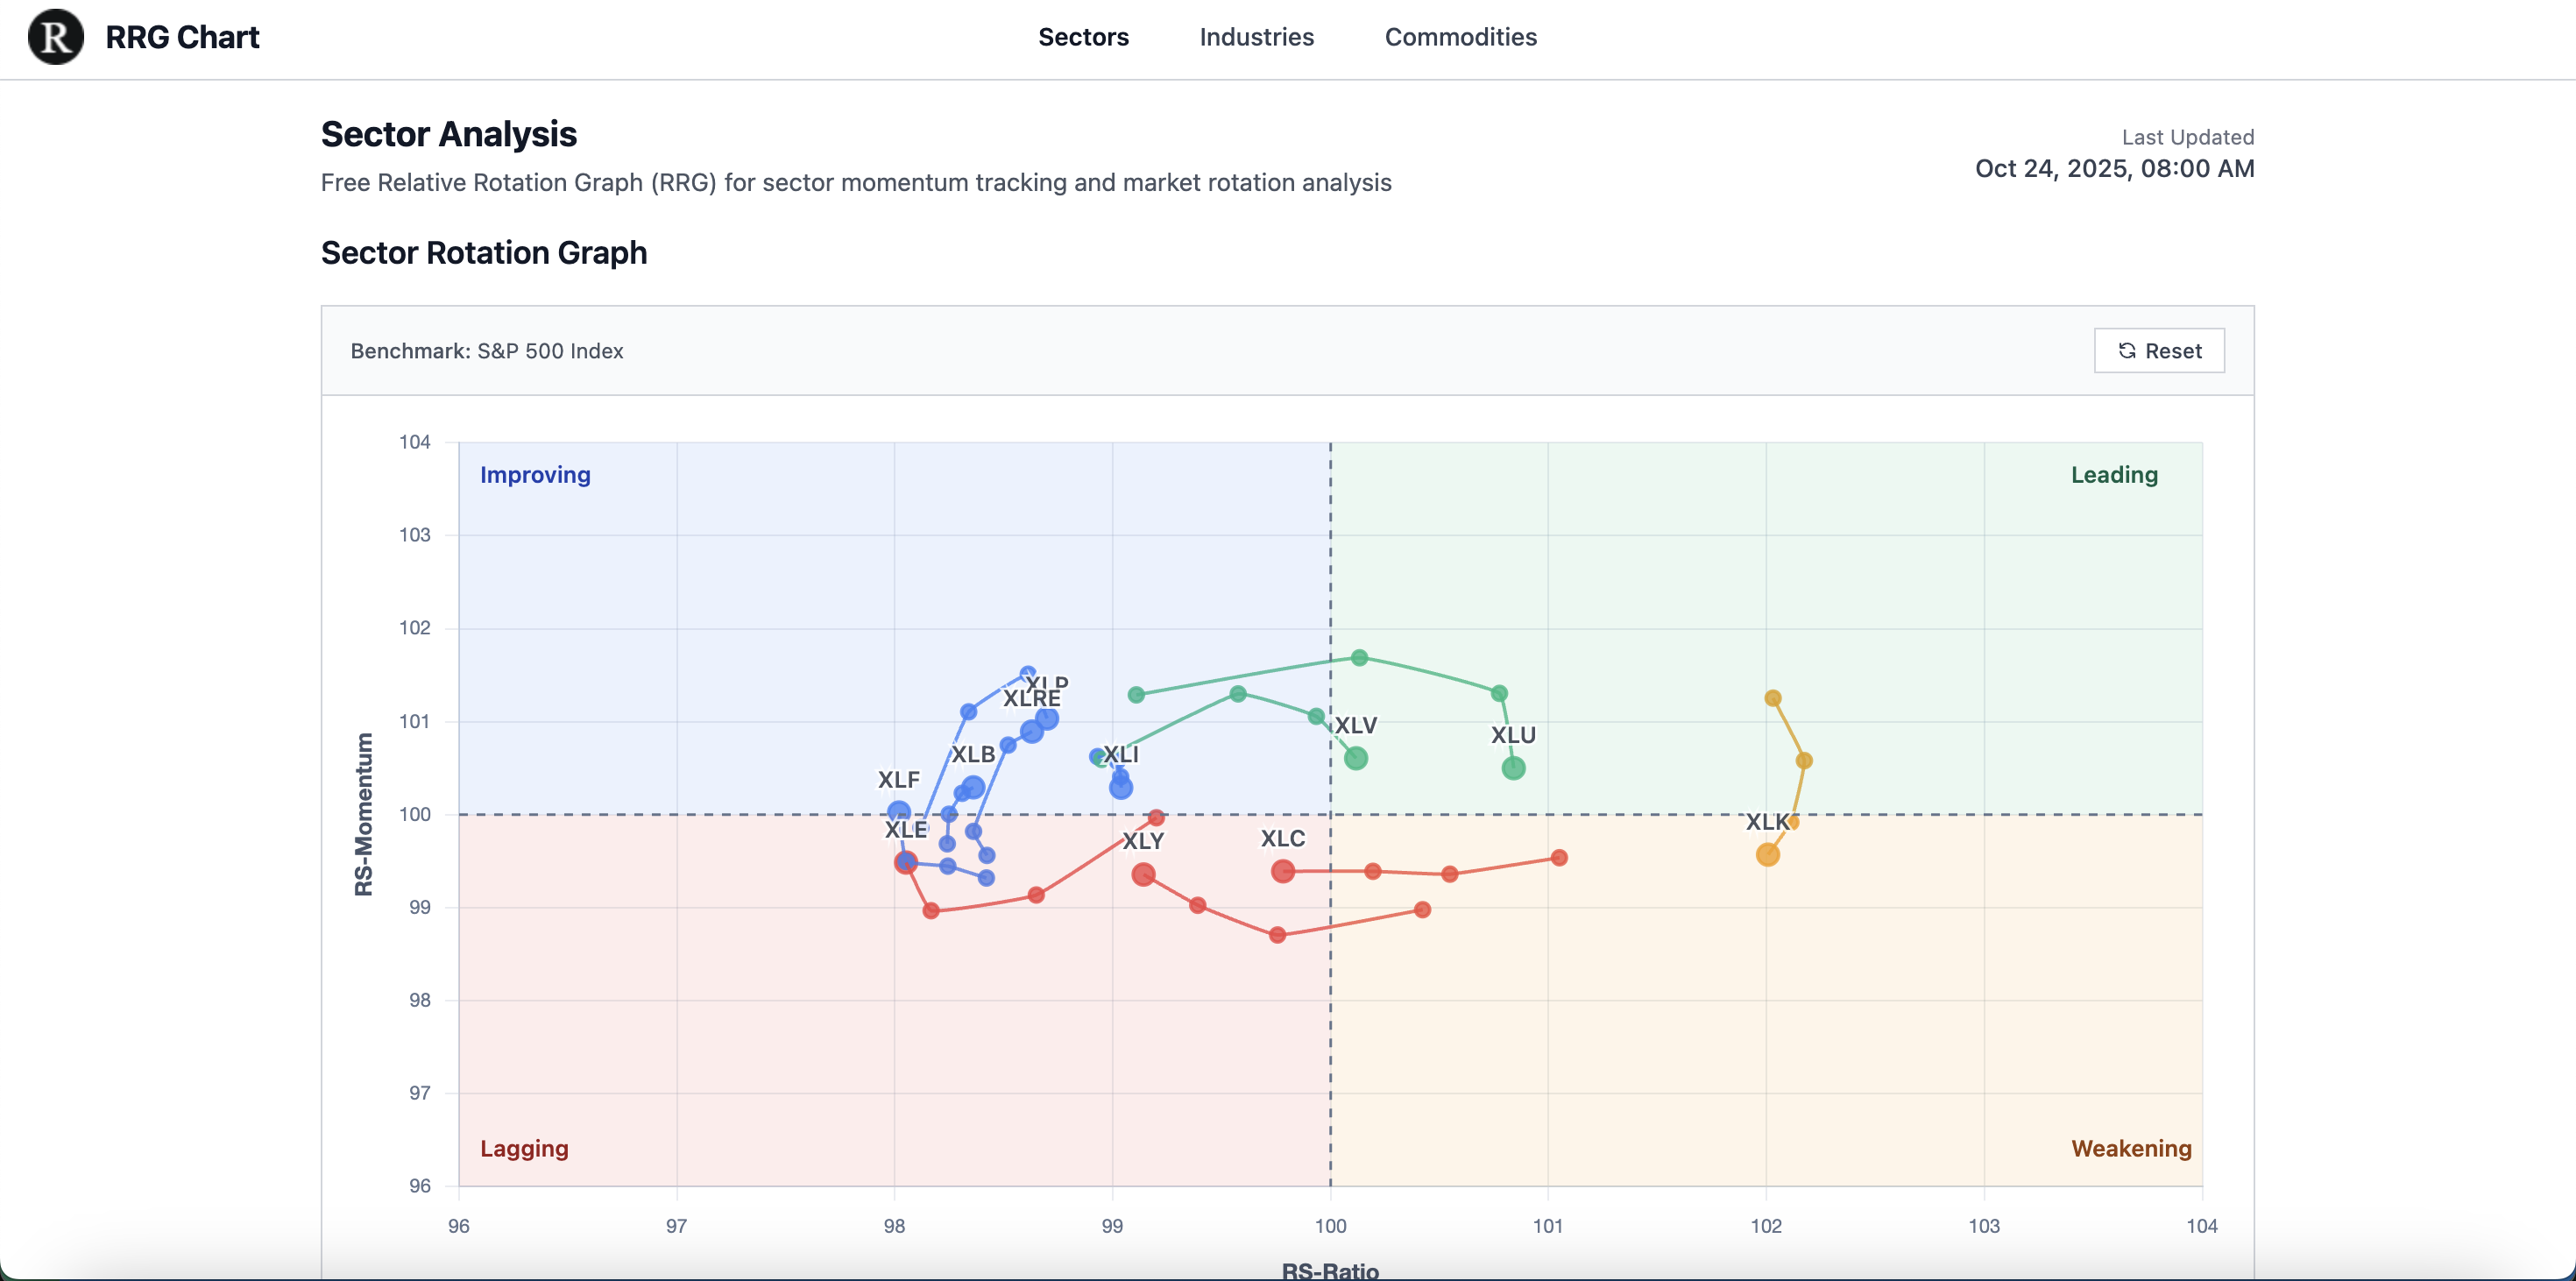
RRG Chart is a free, professional-grade Relative Rotation Graph analysis tool that democratizes advanced market rotation analysis for all investors. Unlike expensive institutional platforms, RRG Chart provides unlimited access to sector, industry, and commodity momentum tracking without subscription fees or usage limits. The platform features interactive RRG charts that visually identify which sectors are leading, weakening, lagging, or improving relative to market benchmarks, helping users spot market leadership shifts and rotation patterns in real-time.
Built with modern web technologies, RRG Chart offers a clean, professional interface optimized for financial workflows. The tool updates weekly with fresh market data and provides up to one year of historical data for comprehensive trend analysis and backtesting. Whether you're an individual trader analyzing sector momentum or a portfolio manager tracking market rotation dynamics, RRG Chart makes institutional-quality analysis tools accessible to everyone, completely free of charge.
Features
- Free RRG Analysis - Complete Relative Rotation Graph tools with no subscription fees or usage limits
- Interactive Charts - Professional-grade RRG visualizations with zoom, pan, and hover effects
- Quadrant Analysis - Visual identification of leading, weakening, lagging, and improving sectors
- Multi-Level Analysis - Sector, industry, and commodity rotation tracking
- Momentum Tracking - RS-Ratio and RS-Momentum calculations with configurable time windows
- Historical Data - Up to 1 year of historical RRG data for trend analysis and backtesting
- Real-Time Updates - Weekly data updates with latest market information
- Professional Interface - Clean, responsive design optimized for financial workflows
- Time Series Analysis - Track sector rotation patterns over time
- Data Tables - Sortable performance tables with detailed sector metrics
- Mobile Responsive - Optimized for desktop and mobile financial analysis
- No Registration Required - Immediate access to all features without signup
Use Cases
- Portfolio Managers - Identify sector rotation opportunities and adjust asset allocation based on market leadership shifts
- Financial Analysts - Track sector momentum patterns and provide market rotation insights to clients
- Individual Investors - Make informed investment decisions by understanding which sectors are leading or weakening
- Traders - Spot early sector rotation signals for tactical trading strategies
- Investment Advisors - Educate clients about market dynamics using visual RRG analysis
- Research Teams - Conduct backtesting and historical analysis of sector rotation patterns
- Risk Managers - Monitor sector concentration risks and identify potential market shifts
- ETF Investors - Choose sector ETFs based on relative strength and momentum indicators
- Market Strategists - Develop market outlook reports using sector rotation analysis
- Educational Purposes - Learn about market rotation dynamics and sector momentum concepts
- Asset Allocation - Optimize portfolio diversification based on sector leadership trends
- Market Timing - Identify entry and exit points for sector-specific investments

Comments


Premium Products


Find your next favorite product or submit your own. Made by @FalakDigital.
Copyright ©2025. All Rights Reserved