
QueryInbox
Search Console and Google Analytics, one dashboard
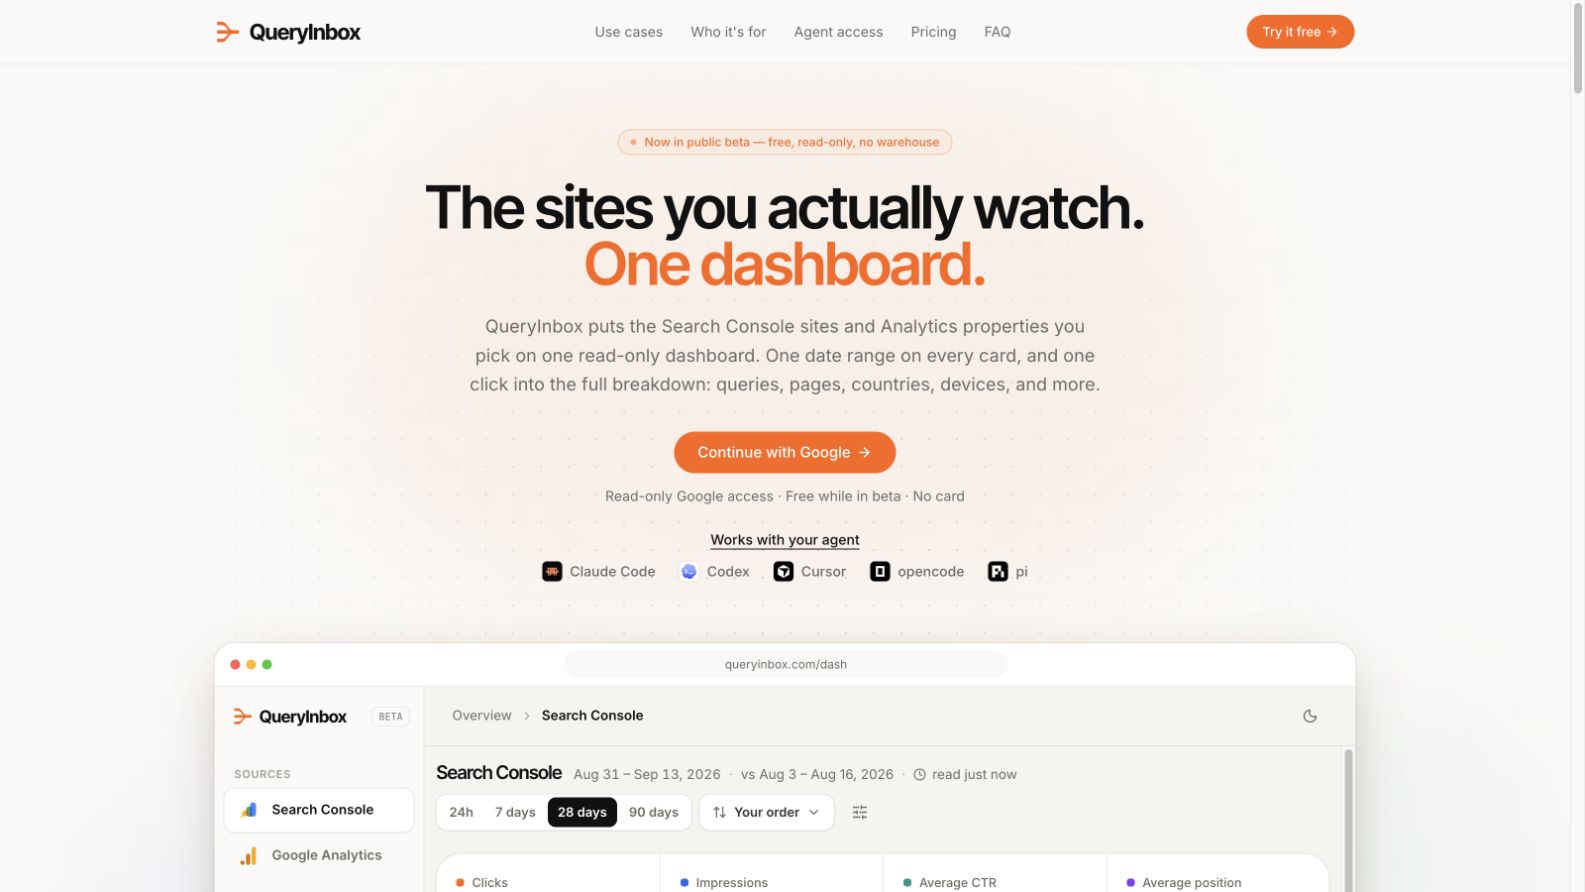
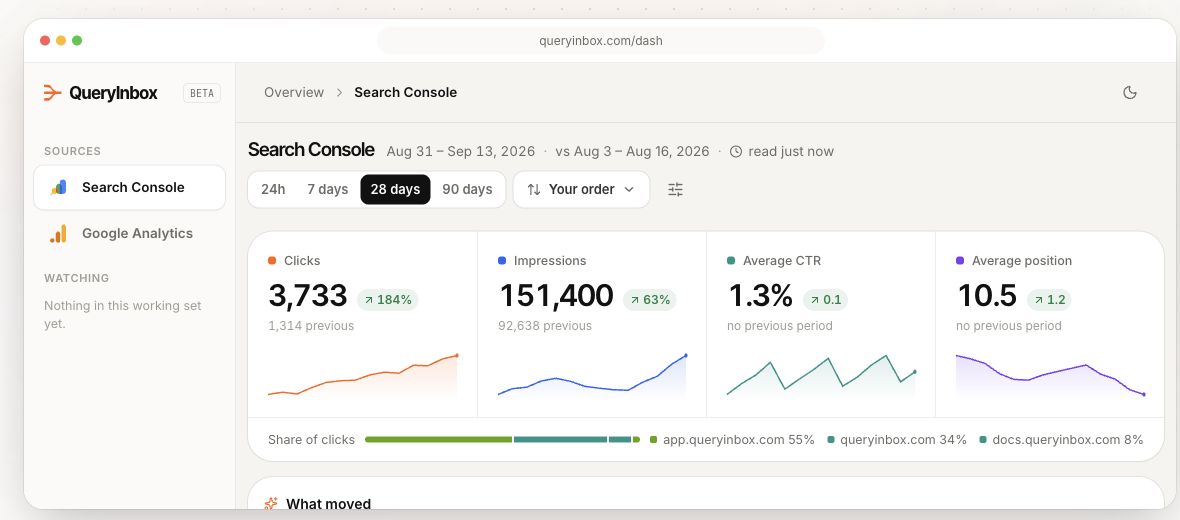
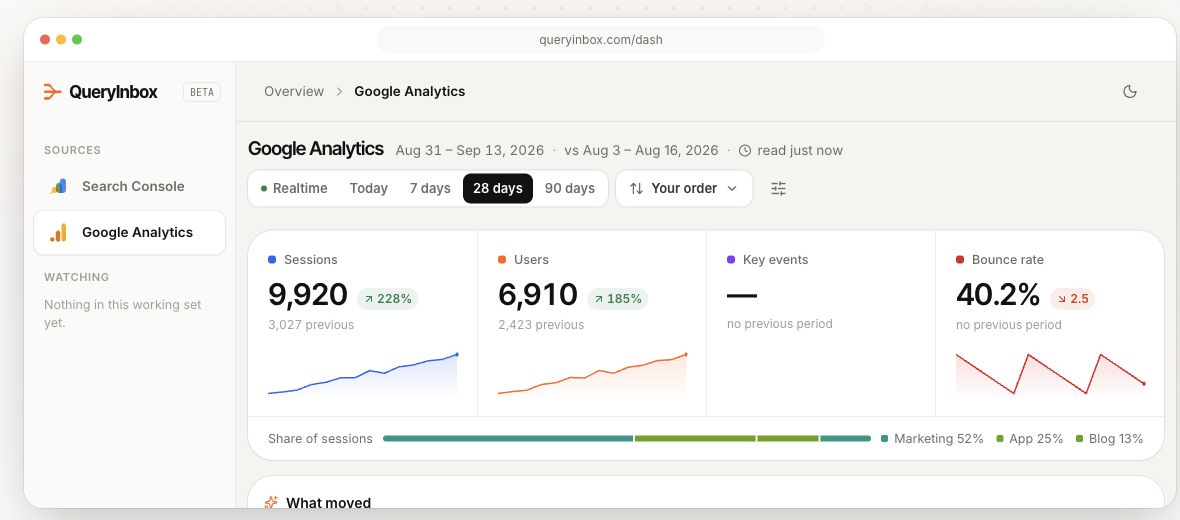
QueryInbox puts the Google Search Console sites and Google Analytics properties you choose on one read-only dashboard. Use a shared date range to scan key metrics, sparklines, and top rows across your sites, then open detailed reports for queries, pages, countries, devices, and traffic sources. Built for site owners, solo SEOs, freelancers, and small agencies. AI agents can read the same reports through an MCP server or REST API using revocable read-only keys. Free while in public beta, with no credit card required.
Features
• Choose the exact Search Console sites and Analytics properties you want to watch.
• Apply 24-hour, 7-day, 28-day, or 90-day ranges across every card.
• Compare key metrics with the previous period.
• Sort and filter detailed Search Console and Google Analytics tables.
• Give AI agents read-only access through MCP or REST API.
Use Cases
• Check a portfolio of websites in one daily sweep.
• Compare client sites over the same date range.
• Find the query or page behind a search traffic change.
• Trace Analytics changes to landing pages and traffic sources.
• Let an AI agent answer questions from the same read-only reports.

Comments

The shared date range with sparklines across all your sites is a smart way to do a quick daily sweep, and the read-only MCP/REST keys for agents are a thoughtful touch. One suggestion: a combined view that flags pages where Search Console clicks fall while Analytics sessions stay flat could make the two data sources even more useful together. Are you planning to support exporting those cross-site summaries for client reports?

The read-only MCP access is a smart touch. Being able to ask an agent "which page lost clicks this week and why" across several sites saves a lot of tab-switching. Question: when you compare with the previous period, does the comparison follow the selected range (e.g. 28 days vs the 28 before), and can I pin a custom date for things like a site migration? Would make it much easier to check the before/after.

The shared date range across Search Console and Analytics cards is the part I would actually use for a small portfolio: one 28-day window, then compare to the previous period, instead of hopping between properties. Read-only keys for an MCP or REST agent is a sensible boundary if the agent is only answering questions from those reports. When a site has more than one Analytics property, does the dashboard make you pick one, or can a single card show the property you use for the marketing site next to the app property?

I check Search Console and GA side by side every morning, so the shared range is the part I'd use. One detail: Search Console data usually lags a day or two behind Analytics, so a 24-hour or 7-day card can show clicks falling while sessions look normal, just because the last days aren't in yet. Do you trim the GSC range to the last complete day, or mark the partial days? Without that, the period comparison will look like a drop every morning.
Premium Products
















































Sponsors
Buy

Makers
Makers
Comments
The shared date range with sparklines across all your sites is a smart way to do a quick daily sweep, and the read-only MCP/REST keys for agents are a thoughtful touch. One suggestion: a combined view that flags pages where Search Console clicks fall while Analytics sessions stay flat could make the two data sources even more useful together. Are you planning to support exporting those cross-site summaries for client reports?
The read-only MCP access is a smart touch. Being able to ask an agent "which page lost clicks this week and why" across several sites saves a lot of tab-switching. Question: when you compare with the previous period, does the comparison follow the selected range (e.g. 28 days vs the 28 before), and can I pin a custom date for things like a site migration? Would make it much easier to check the before/after.
The shared date range across Search Console and Analytics cards is the part I would actually use for a small portfolio: one 28-day window, then compare to the previous period, instead of hopping between properties. Read-only keys for an MCP or REST agent is a sensible boundary if the agent is only answering questions from those reports. When a site has more than one Analytics property, does the dashboard make you pick one, or can a single card show the property you use for the marketing site next to the app property?
I check Search Console and GA side by side every morning, so the shared range is the part I'd use. One detail: Search Console data usually lags a day or two behind Analytics, so a 24-hour or 7-day card can show clicks falling while sessions look normal, just because the last days aren't in yet. Do you trim the GSC range to the last complete day, or mark the partial days? Without that, the period comparison will look like a drop every morning.
Premium Products
New to Fazier?

Find your next favorite product or submit your own. Made by @FalakDigital.
Copyright ©2026. All Rights Reserved