
ProcessSpy is a lightweight, native macOS process explorer built for developers who need deeper system insights than Apple's default Activity Monitor provides. Serving as a powerful Mac alternative to Sysinternals Process Explorer, it grants power users full visibility into process hierarchies, command-line arguments, environment variables, and active network sockets. Designed to seamlessly integrate into your workflow, it even allows you to automate your system by triggering custom macOS Shortcuts whenever specific processes start or finish.
Features
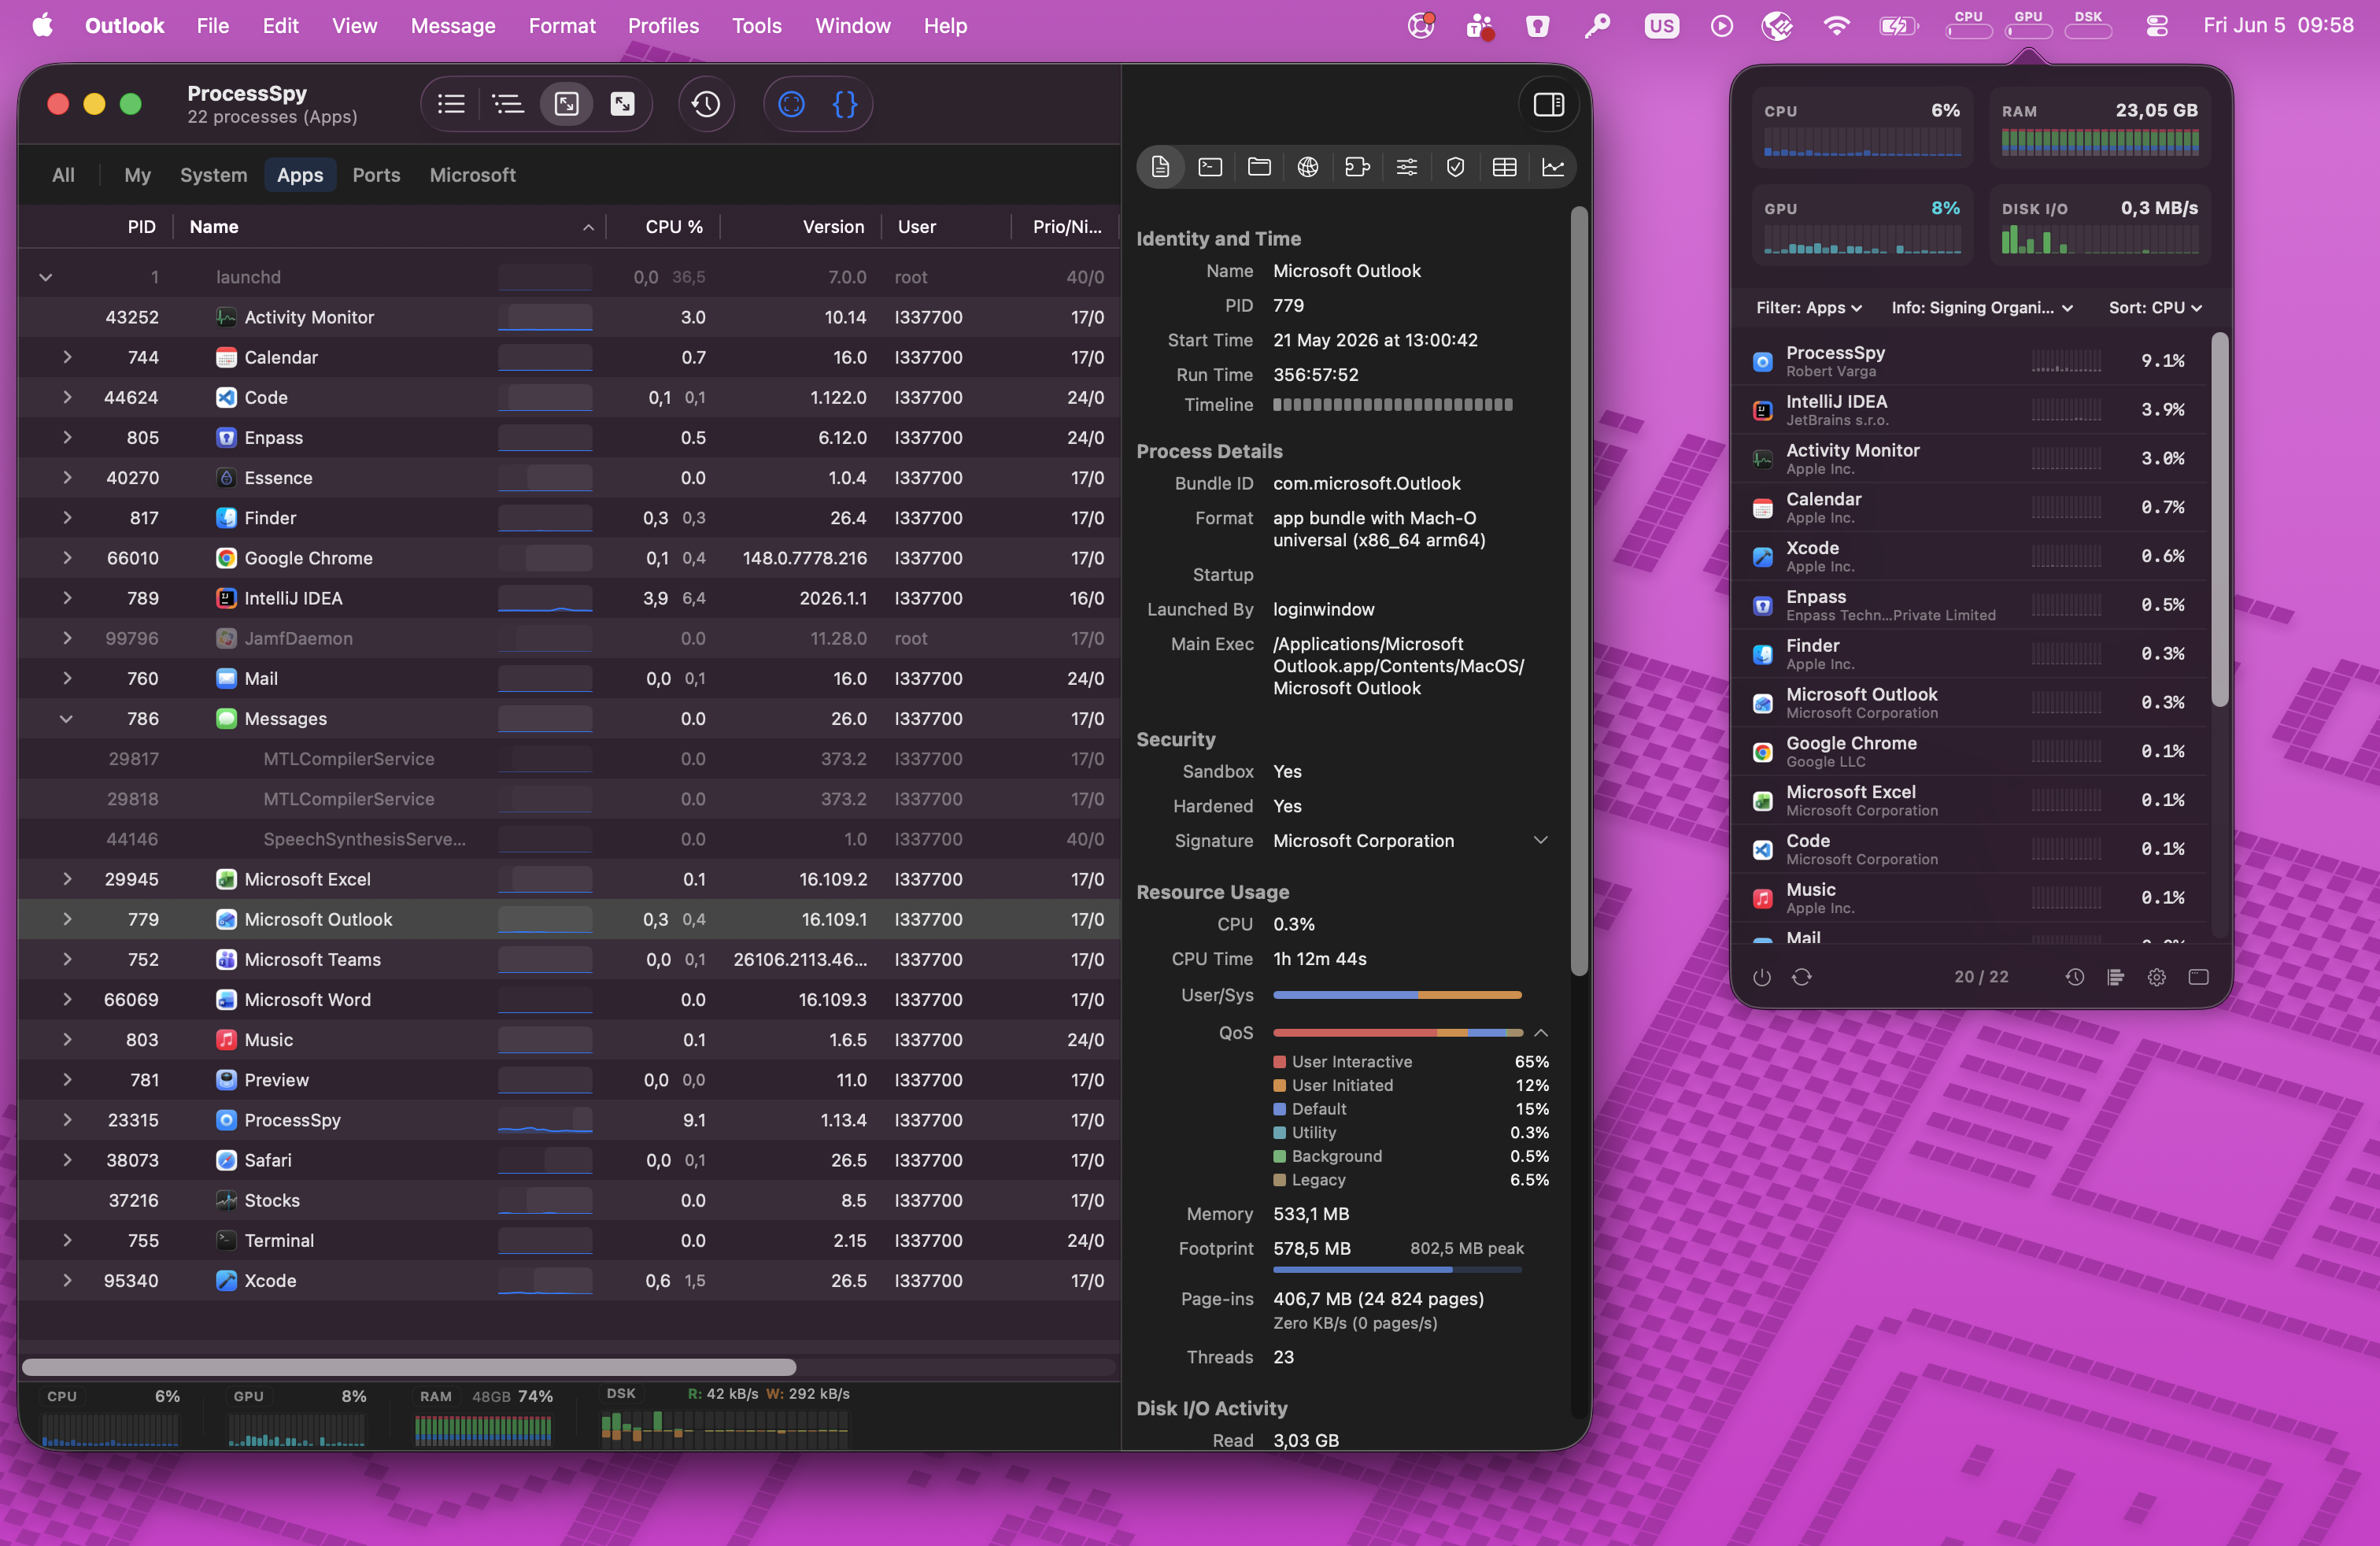
- Real-time process list with CPU, memory, and thread usage
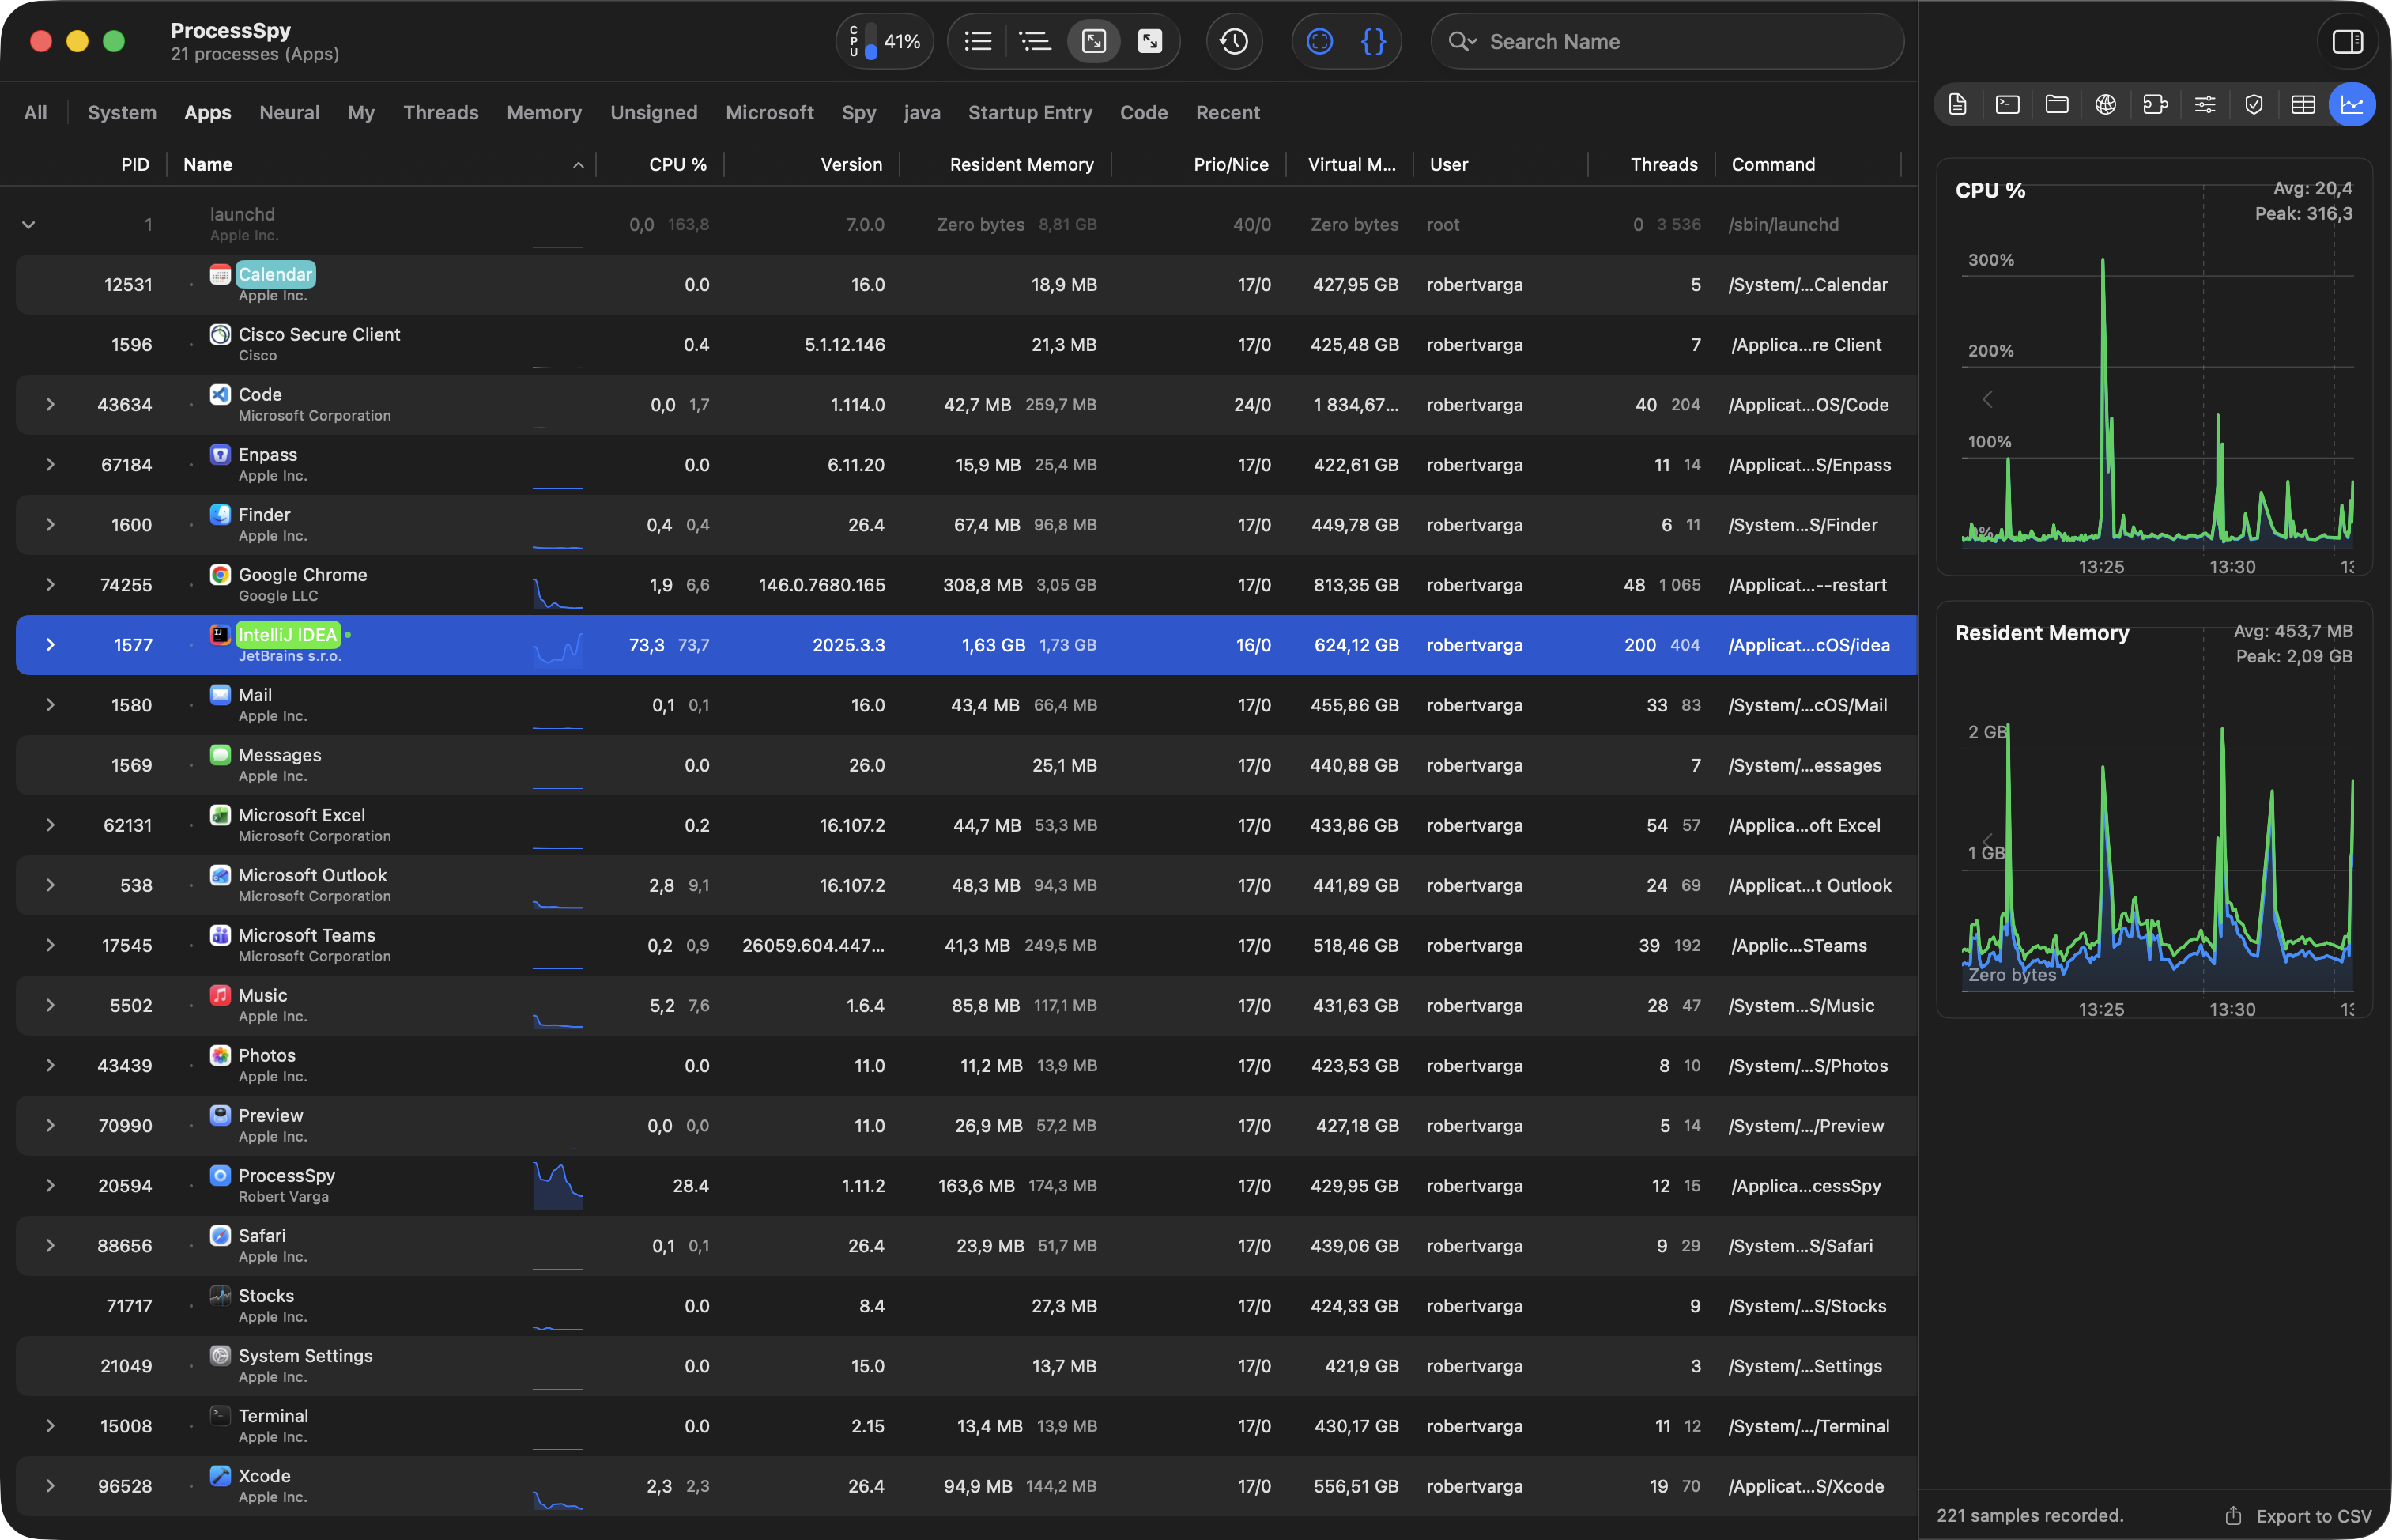
- Per-process CPU & memory history with mini graphs
- Finished process recall (remembers terminated processes)
- CPU QoS breakdown and User/System ratio
- Real-time disk I/O tracking (read/write speeds)
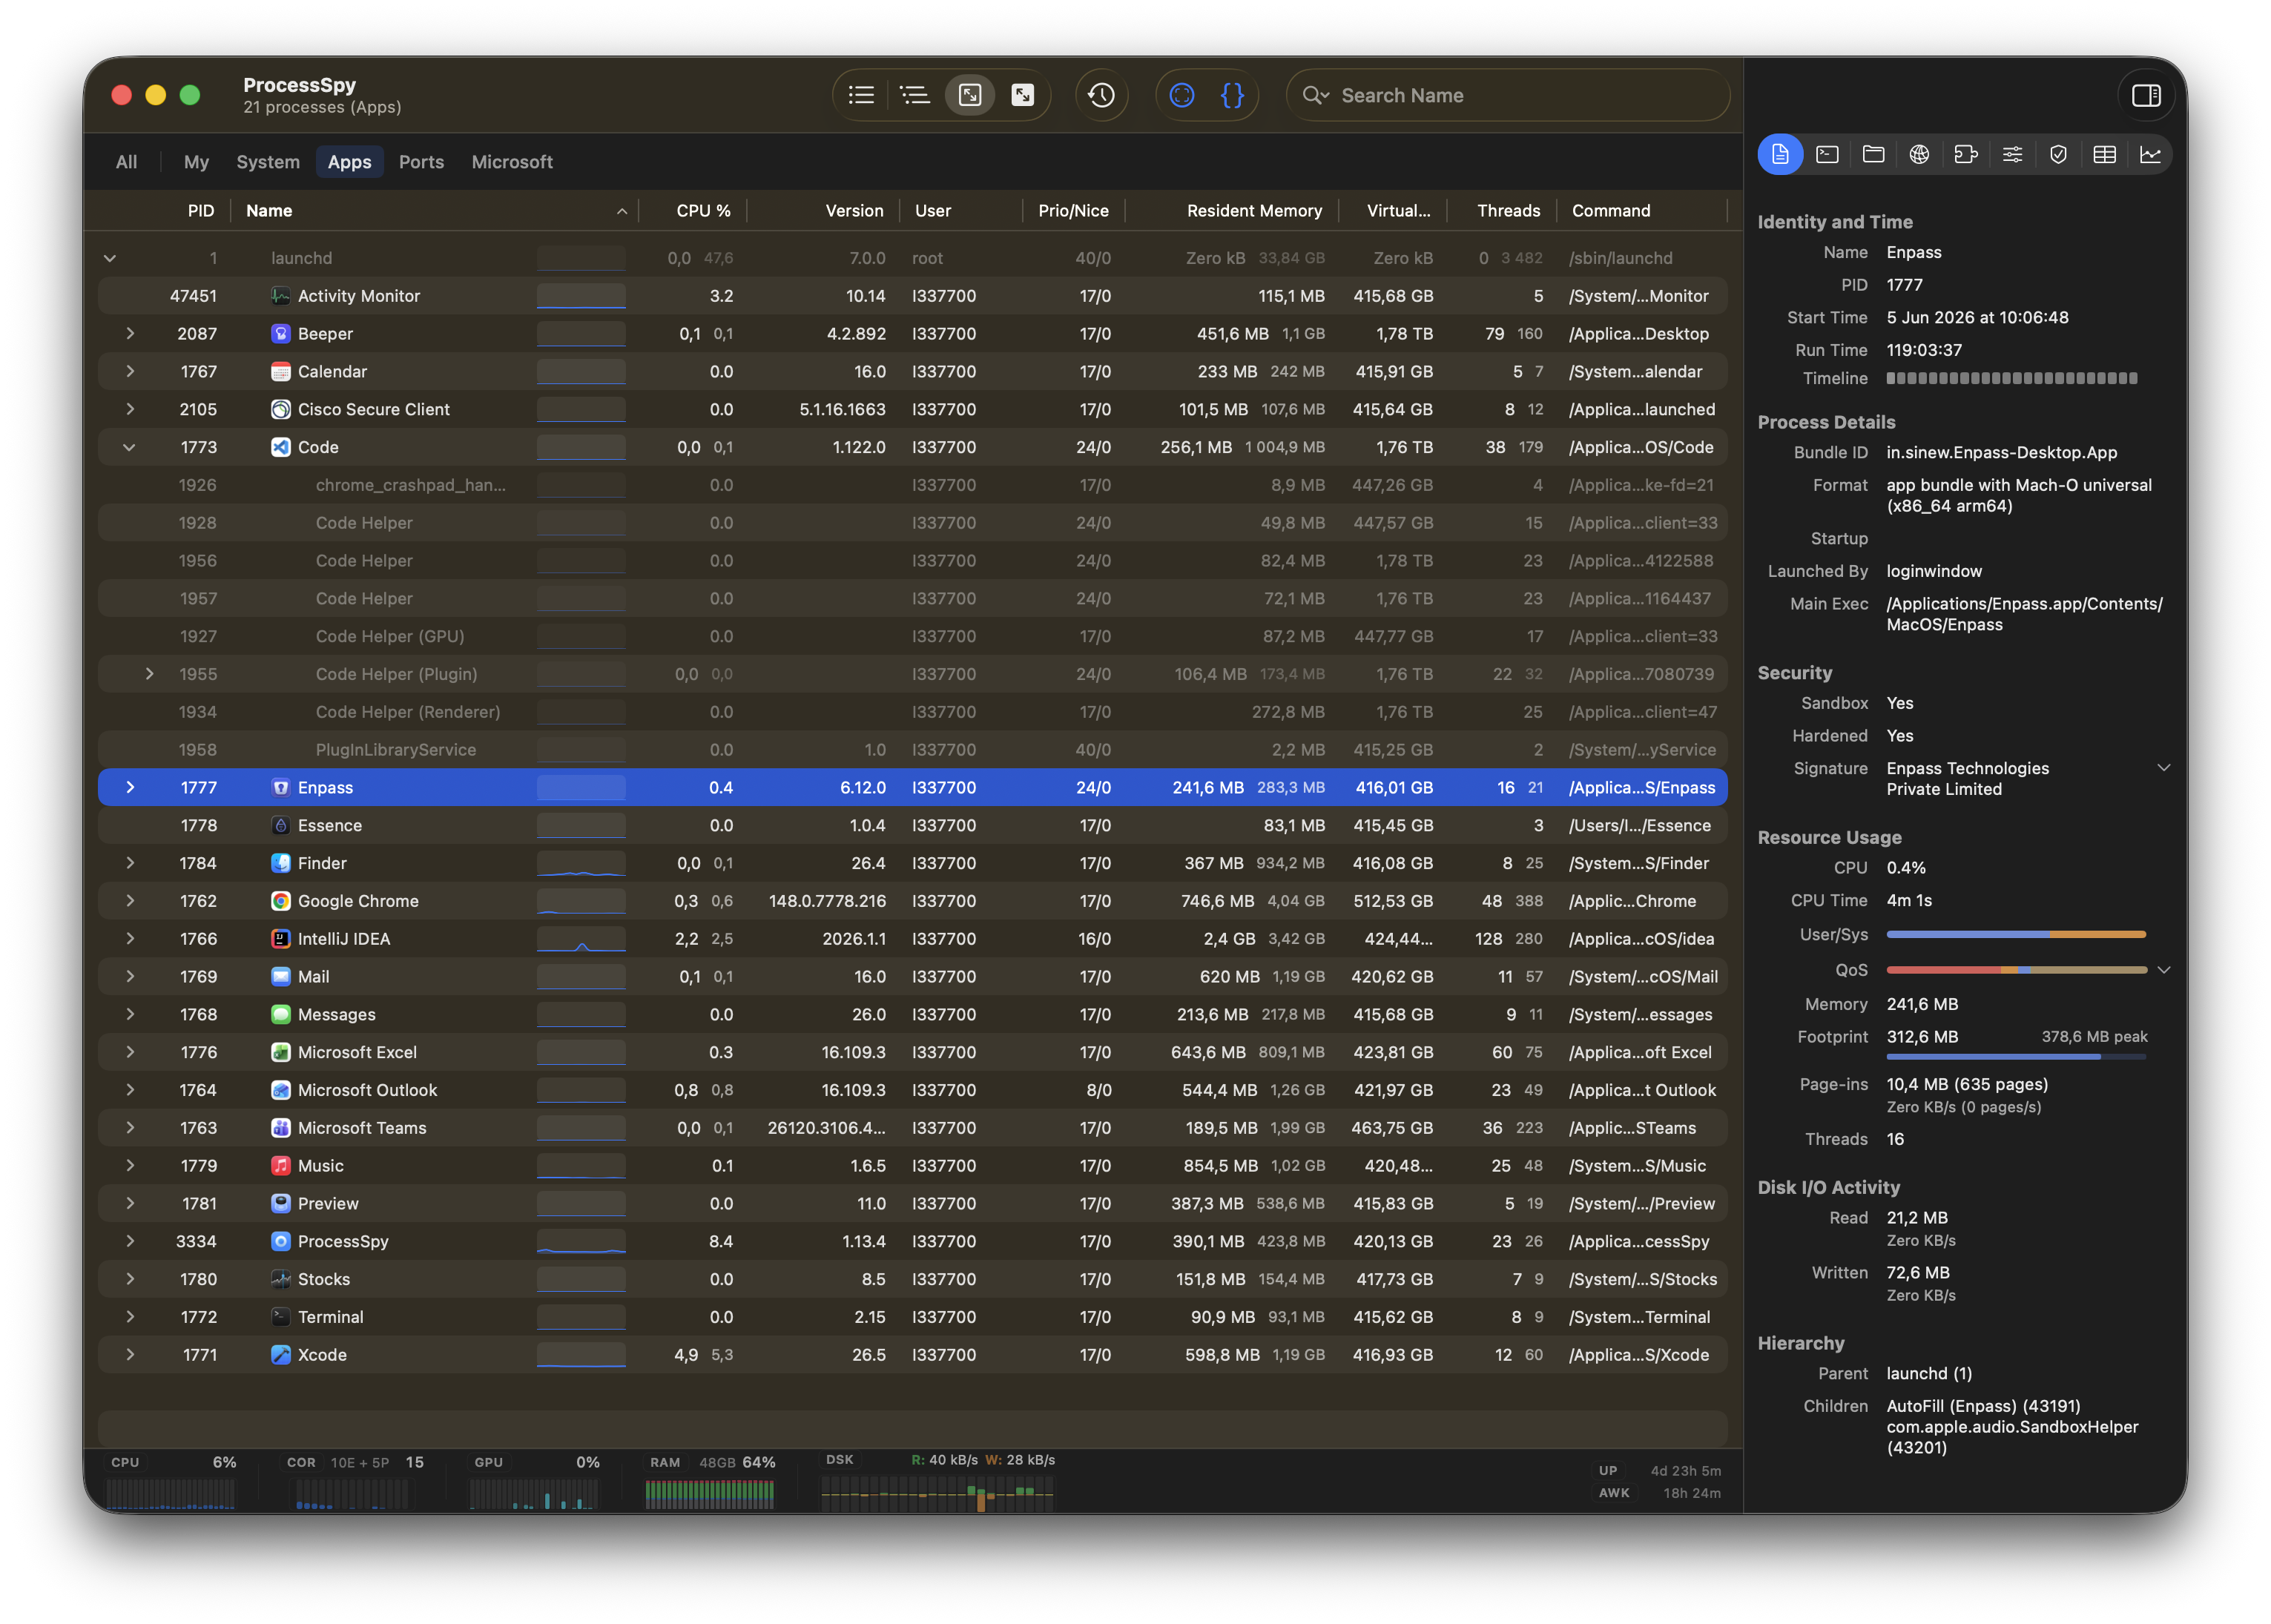
- Full command-line arguments with all arguments visible
- Open files and sockets inspection
- Environment variables viewer (paid feature)
- Digital signatures and entitlements verification (paid)
- Process origin tracking (shows which process launched another)
- Advanced tree view with parent-child relationships
- XPC service linking (groups related XPC services)
- Roll-up aggregate totals for true system impact
- JavaScript filters for custom multi-condition filtering
- Regex + multi-property search across name, command line, files
- Point-and-click discovery for process hierarchies
- Aggregate totals in hierarchy view
- macOS Shortcuts triggers when processes start/end
- Menu bar dashboard for real-time system health
- Context menu actions (show in Finder, copy path, search online, pause/resume, kill)
- Export to CSV/JSON
- Lightweight and efficient (minimal CPU/memory usage)
- Native macOS APIs for accurate data
- Unresponsive app detection
Use Cases
- Debugging performance issues by identifying CPU/memory spikes in real-time
- Troubleshooting stubborn apps that won't close (kill unresponsive processes instantly)
- Finding what files or network connections a process is using
- Understanding process hierarchies and which app launched another process
- Analyzing command-line arguments passed to processes (e.g., Java -Xmx flags)
- Monitoring background processes consuming resources without visible UI
- Verifying app authenticity through digital signatures and entitlements
- Automating workflows with macOS Shortcuts triggered by process events
- Exporting process data for post-analysis or reporting (CSV/JSON)
- Setting up JavaScript filters to spotlight specific processes you care about
- Tracking disk I/O to find which process is writing heavily to storage
- Checking memory pressure rates to diagnose slowdowns
- Searching across multiple properties at once (e.g., find all Java processes with specific flags)
- Monitoring system health from the menu bar without opening the app
- Reviewing history of terminated processes to see what just ran
- Grouping XPC services to understand macOS app architecture
- Seeing aggregate CPU/memory of entire process trees (not just individual processes)

Comments


The terminated-process recall plus full command-line and environment visibility solves a real gap in Activity Monitor. For debugging intermittent dev environment issues, CSV/JSON export would be even more useful if it included a short capture window around process start/end and the parent chain, so a snapshot can be shared later without keeping ProcessSpy open.


I was juggling several Java apps, each using a different JDK version — and I couldn't tell which process was which in Activity Monitor. All I saw was "java". No version, no path, no details. So I built ProcessSpy — a developer-focused native macOS process explorer that shows full command-line info, version details, environment variables, and more. It's the Sysinternals Process Explorer equivalent for macOS, revealing what Activity Monitor hides: process trees, open files, environment variables, and instant kill for stubborn apps.
Premium Products


Sponsors
BuyMakers
Makers
Comments
The terminated-process recall plus full command-line and environment visibility solves a real gap in Activity Monitor. For debugging intermittent dev environment issues, CSV/JSON export would be even more useful if it included a short capture window around process start/end and the parent chain, so a snapshot can be shared later without keeping ProcessSpy open.
I was juggling several Java apps, each using a different JDK version — and I couldn't tell which process was which in Activity Monitor. All I saw was "java". No version, no path, no details. So I built ProcessSpy — a developer-focused native macOS process explorer that shows full command-line info, version details, environment variables, and more. It's the Sysinternals Process Explorer equivalent for macOS, revealing what Activity Monitor hides: process trees, open files, environment variables, and instant kill for stubborn apps.
Premium Products
New to Fazier?

Find your next favorite product or submit your own. Made by @FalakDigital.
Copyright ©2025. All Rights Reserved