Odds Plot
football data analytics odds visualization bookmaker
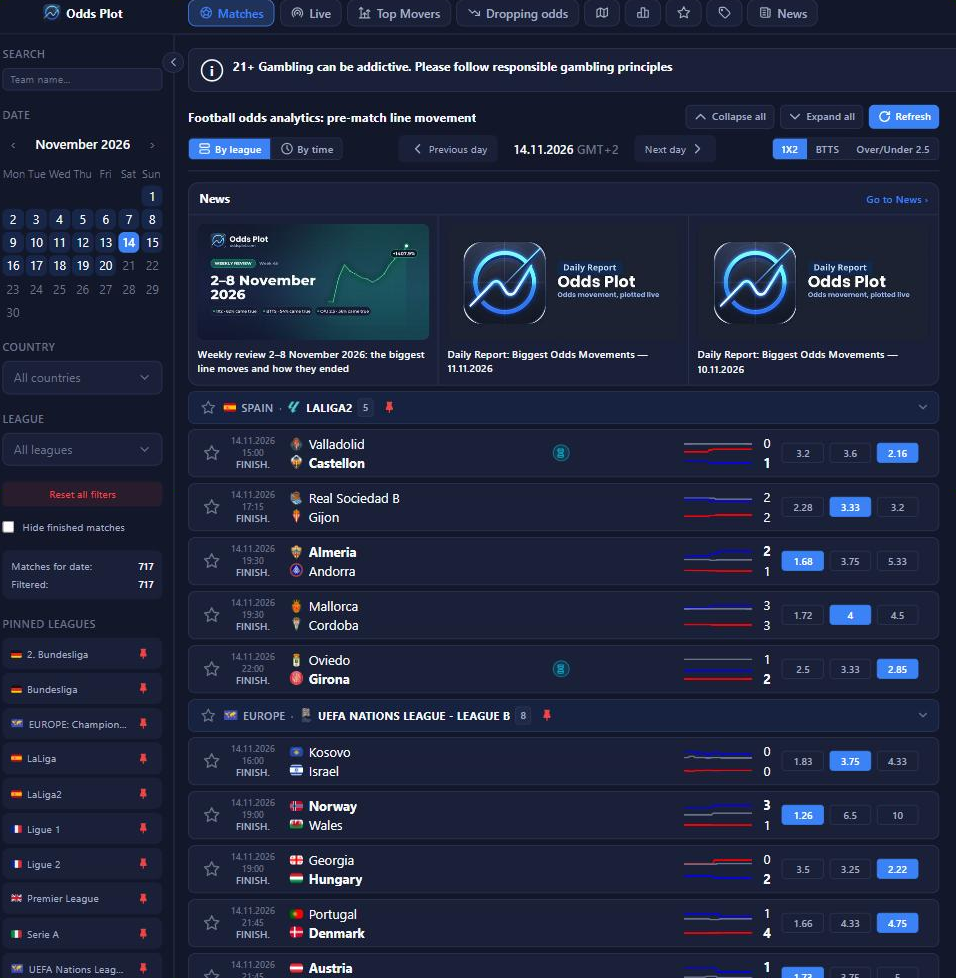
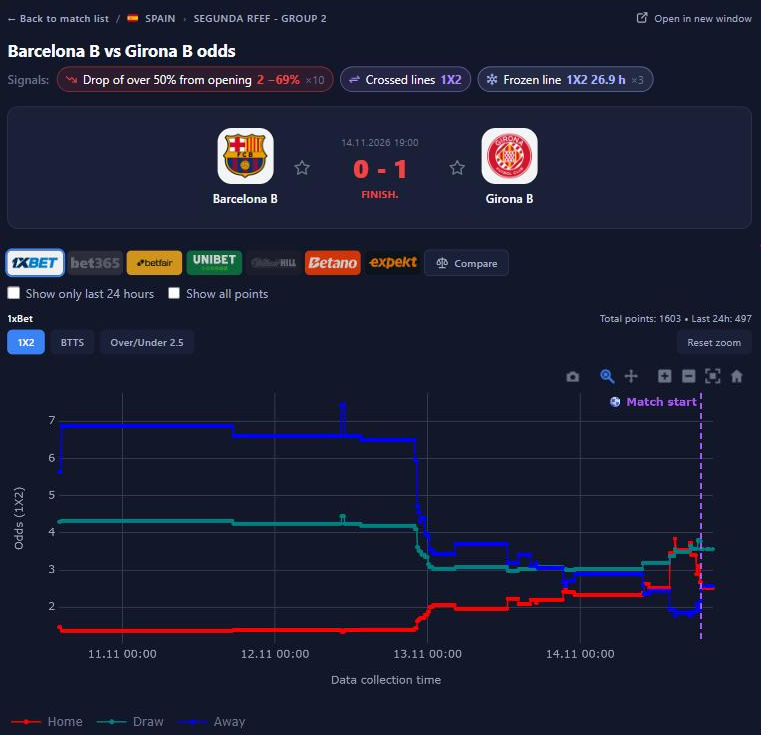
Odds Plot is a football odds analytics website that charts how bookmaker lines move before every match. For each fixture it shows the full history of 1X2, Both Teams to Score and Over/Under 2.5 odds from opening to kick-off, with several bookmakers side by side.
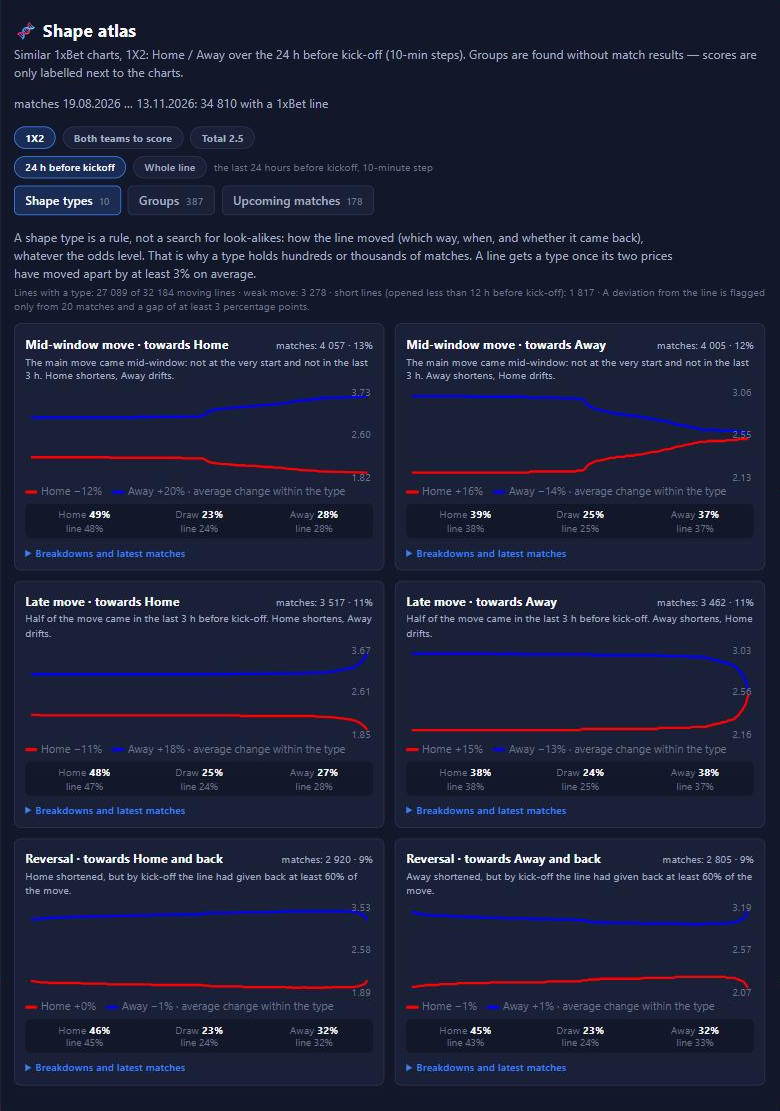
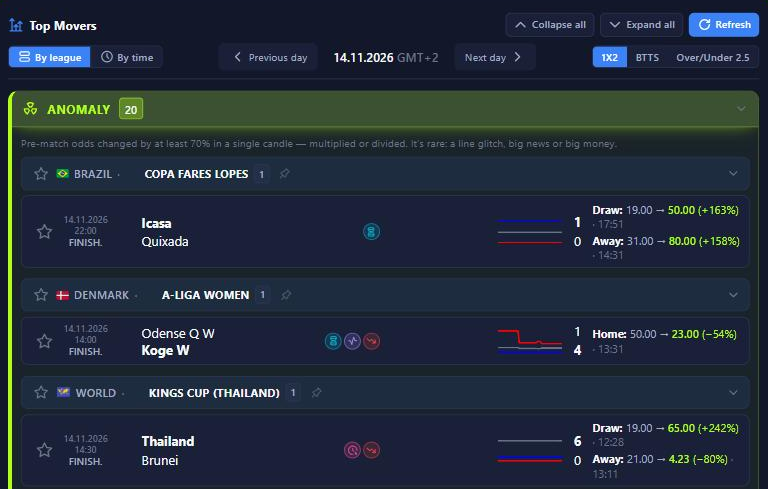
Top Movers collects the day's biggest drops, spikes, anomalies and frozen lines. Signals for sharp drops and jump series are also posted to Telegram. Line accuracy statistics show how often odds movements actually came true, and match pages summarize opening vs closing odds.
Available in English, Ukrainian, Portuguese, Spanish and French. Free to use, with optional Pro and VIP plans for extra alerts. An analytics tool, not a tipster. 18+.
Features
- Odds movement charts — full history of 1X2, Both Teams to Score and Over/Under 2.5 odds for each match, from opening to kick-off
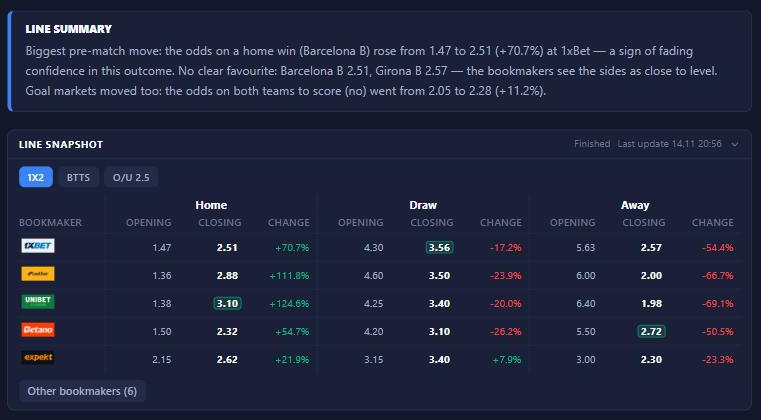
- Several bookmakers side by side — compare how different books moved the same line
- Top Movers — the day's biggest drops, spikes, anomalies and frozen lines in one place
- Signals — sharp drops, jump series, anomalies and frozen lines, also posted to Telegram channels and the Telegram bot
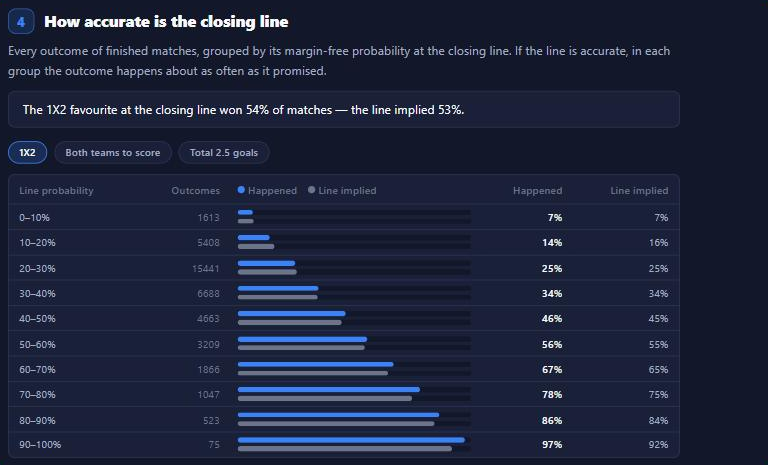
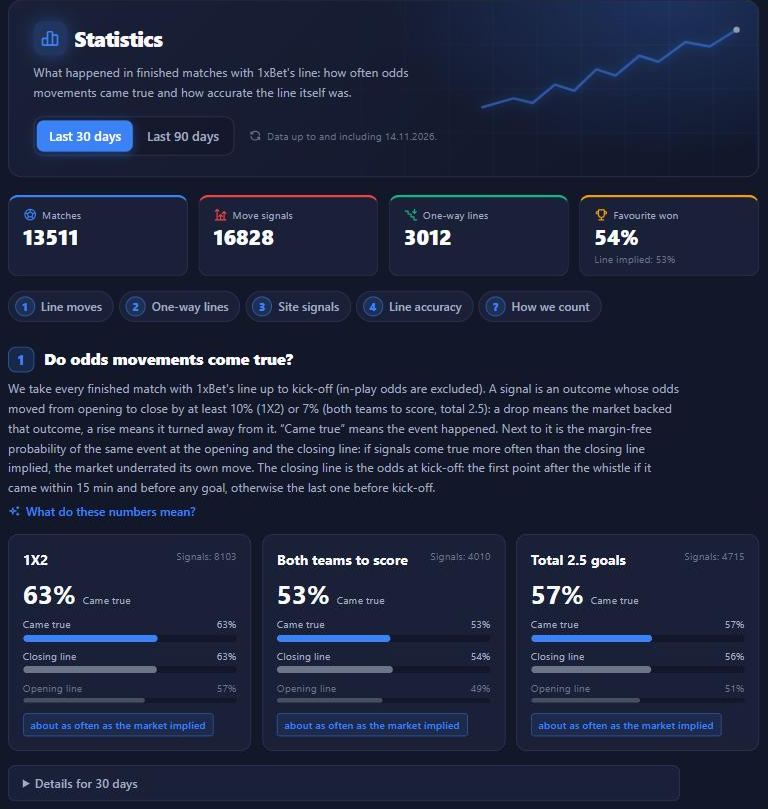
- Line accuracy statistics — how often odds movements actually came true compared with what the market implied
- Match pages — line summary and opening vs closing odds snapshot
- 5 languages (English, Ukrainian, Portuguese, Spanish, French), dark and light themes
- Free to use, with optional Pro and VIP plans for extra alerts
Use Cases
- Spot where the market is moving before kick-off — see which outcome is being backed and when the move started - Tell a real move from a glitch — anomalies and frozen lines flag odd behaviour worth a closer look - Compare bookmakers — check whether a drop is happening everywhere or only at one book - Follow the market without watching screens — get signals in Telegram as they happen - Research how markets behave — opening vs closing odds and line accuracy stats over 30 or 90 days - Analyse a finished match — review how the line reacted to team news, line-ups and early goals
Fazier Deal
Comments


Hi Fazier! I'm Oleh, a solo developer from Ukraine. I built Odds Plot because I wanted to understand how bookmaker odds change before football matches. I wanted to see not just the current odds, but the full picture of how they move from opening to kick-off. With Odds Plot, you can track odds changes using charts, find the biggest drops and unusual movements, and receive alerts about sharp drops, sudden jumps and frozen odds. You can also get notifications in Telegram. The platform supports 5 languages and is free to use. There is also a Pro plan with additional alerts. Odds Plot is an analytics tool, not a betting tipster. It doesn't promise guaranteed wins — it simply helps you understand the data. 18+. I'd love to hear your feedback! What features would make Odds Plot more useful for you?
Premium Products















































Fazier Deal
Makers
Makers
Comments
Hi Fazier! I'm Oleh, a solo developer from Ukraine. I built Odds Plot because I wanted to understand how bookmaker odds change before football matches. I wanted to see not just the current odds, but the full picture of how they move from opening to kick-off. With Odds Plot, you can track odds changes using charts, find the biggest drops and unusual movements, and receive alerts about sharp drops, sudden jumps and frozen odds. You can also get notifications in Telegram. The platform supports 5 languages and is free to use. There is also a Pro plan with additional alerts. Odds Plot is an analytics tool, not a betting tipster. It doesn't promise guaranteed wins — it simply helps you understand the data. 18+. I'd love to hear your feedback! What features would make Odds Plot more useful for you?
Premium Products
New to Fazier?

Find your next favorite product or submit your own. Made by @FalakDigital.
Copyright ©2026. All Rights Reserved