
MakeGraph
Fast Online Chart Creation for Everyone
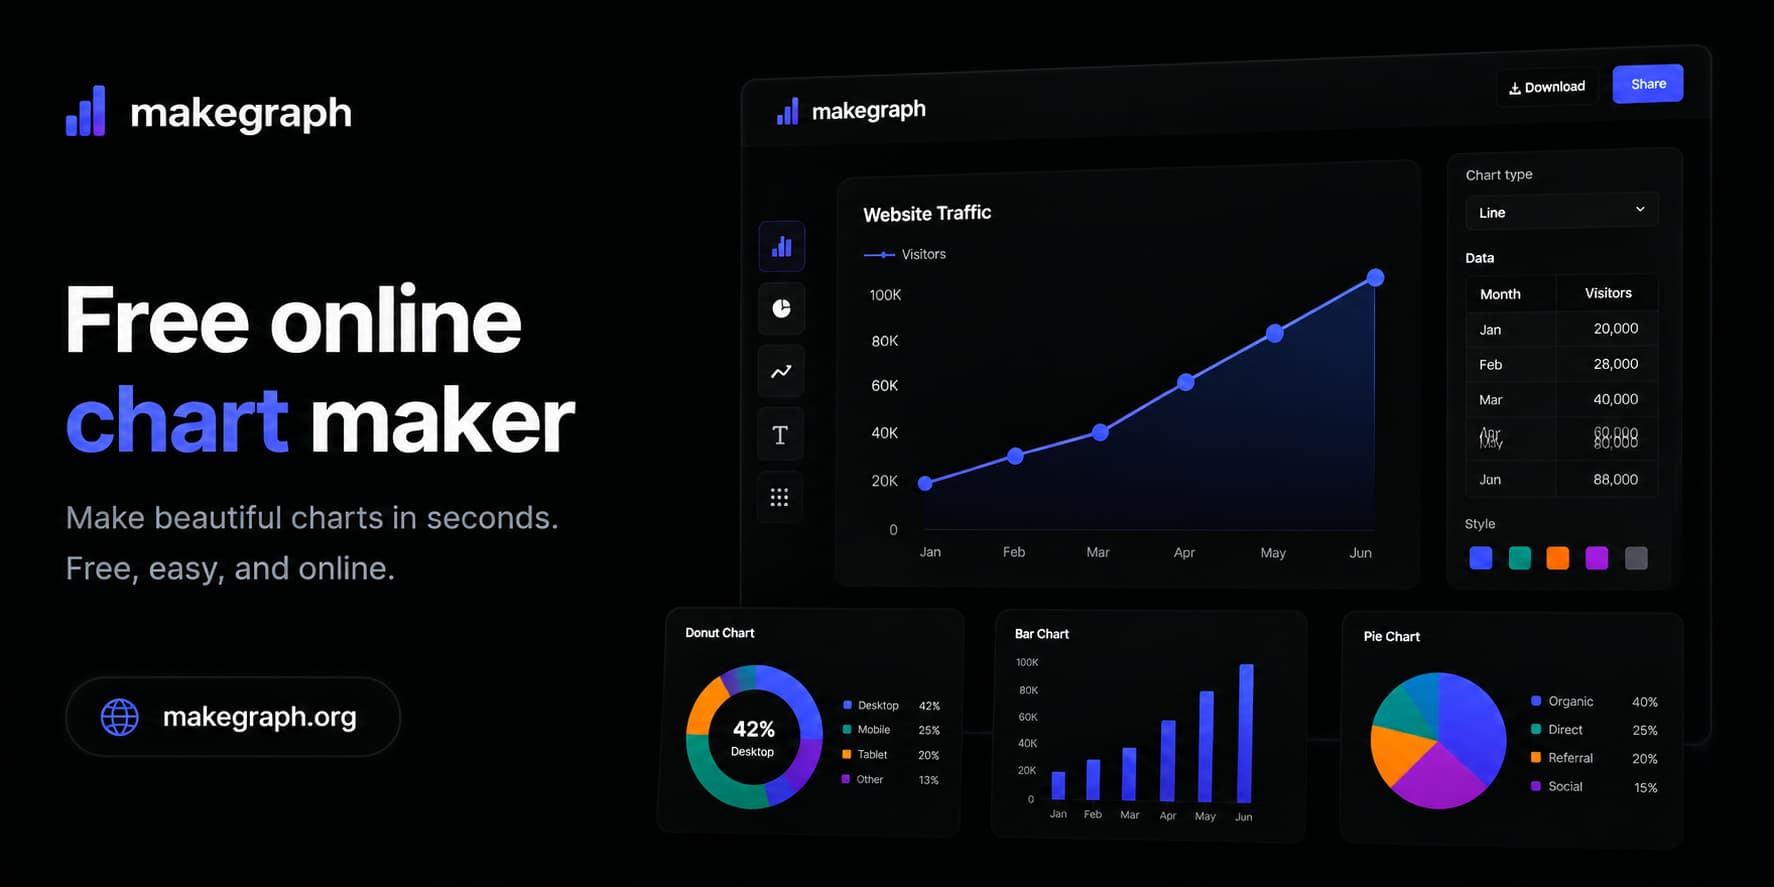
MakeGraph is a lightweight online chart creation tool designed for people who need charts quickly.
Instead of learning complex visualization software or configuring dozens of chart settings, users can simply import data, make quick edits, and instantly generate clear, presentation-ready charts.
Features
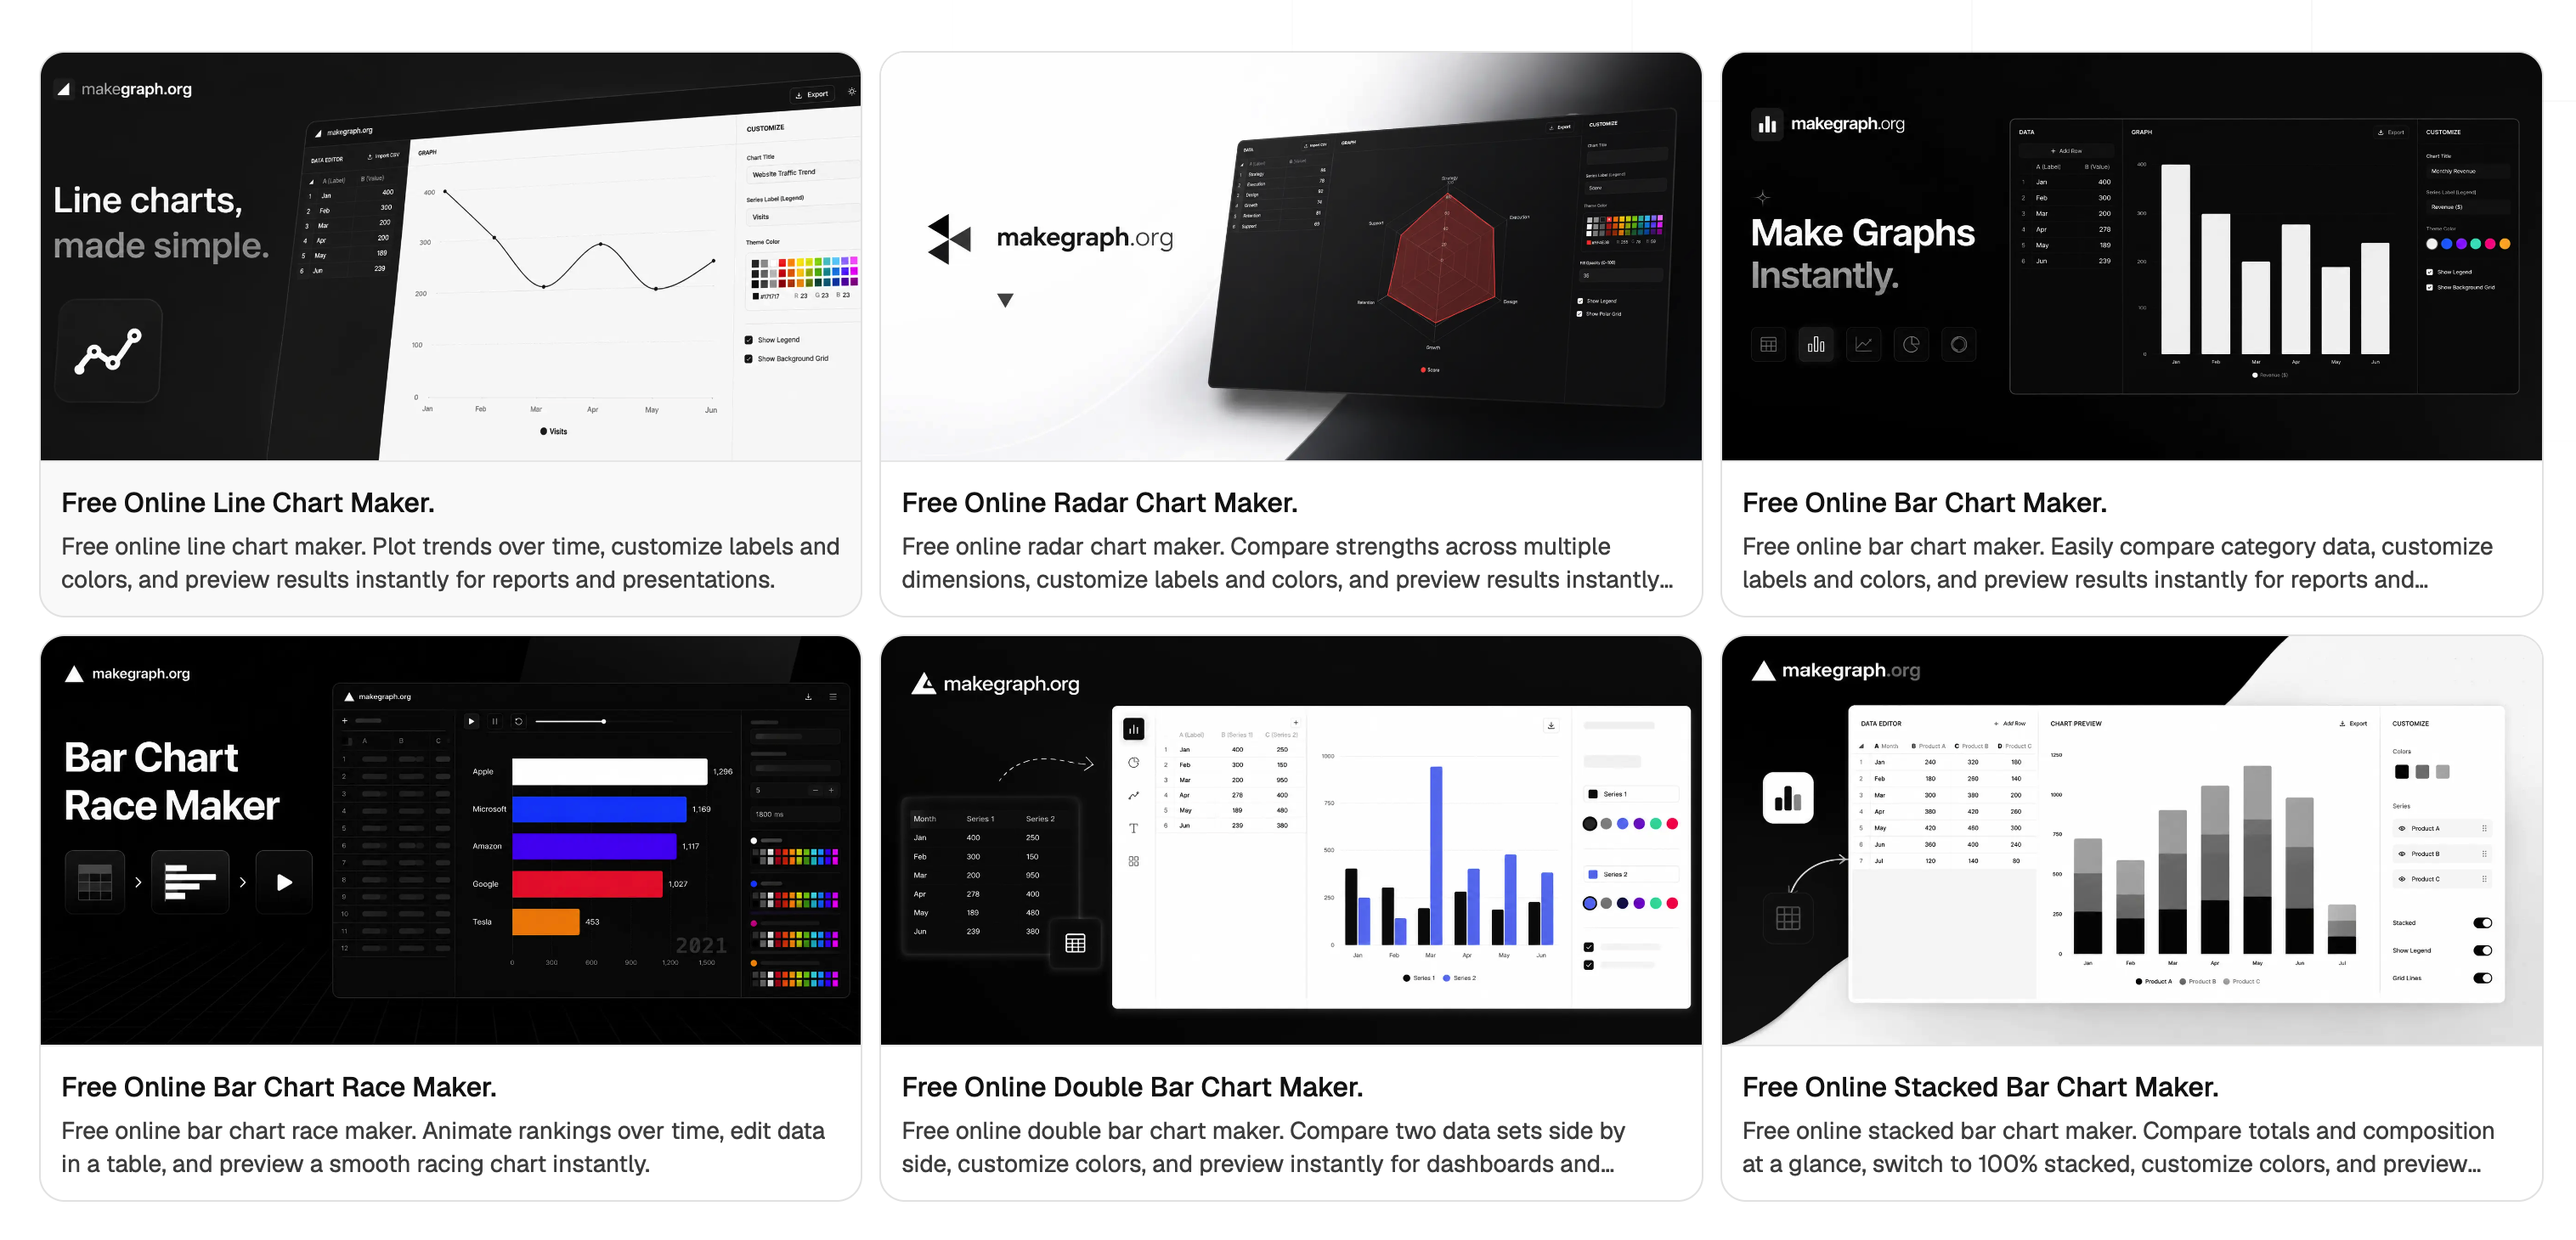
- Fast data input
- Paste data from Excel, Sheets, or CSV and start instantly.
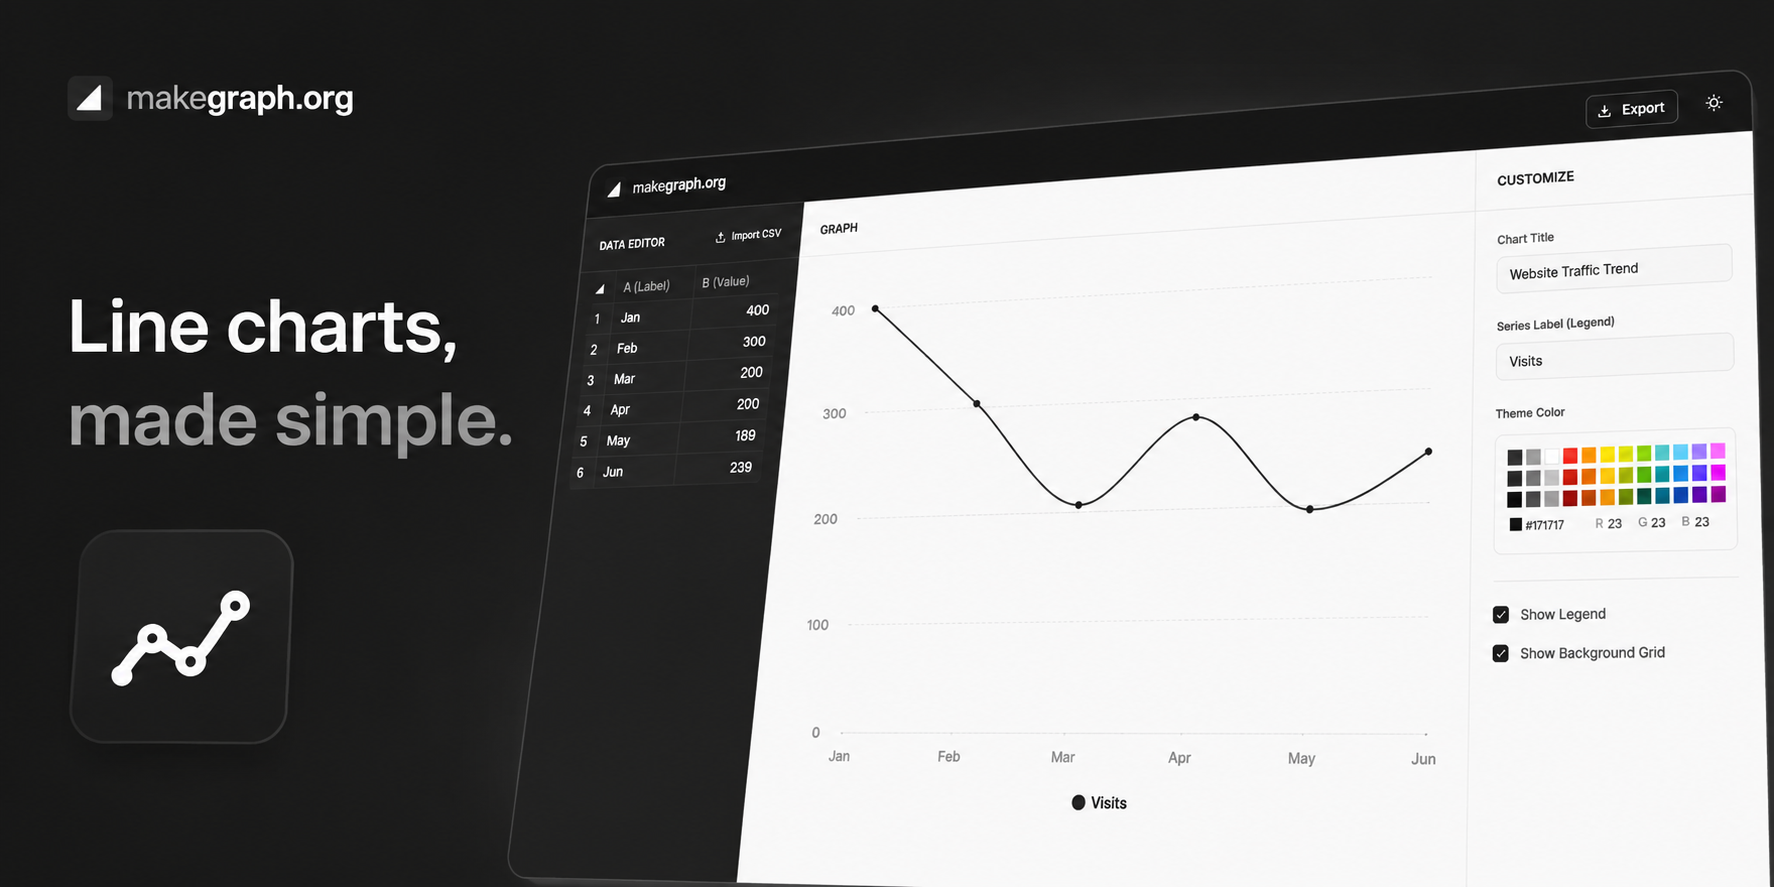
- Live preview
- See chart updates in real time while editing data and styles.
- Easy customization
- Adjust labels, colors, and layout with simple controls.
- Quick export
- Download clean charts for reports, slides, and content.
Use Cases
- Business reporting
- Show revenue, budget, KPI, and category comparisons clearly.
- Marketing analysis
- Visualize campaign results, traffic trends, and channel performance.
- Education
- Present assignments, surveys, and research in a simple visual format.
- Content creation
- Make charts for blogs, newsletters, and presentations quickly.

Comments


The description clearly explains what MakeGraph does and the pain point it addresses. However, it could be even more compelling by emphasizing the end benefit to users (such as saving time or creating professional charts effortlessly) and mentioning a few standout features that differentiate it from other charting tools.


Love that this lowers the barrier for non designers. Most charting tools assume you already know which chart type fits your data, which is where people actually get stuck. Does MakeGraph suggest a chart type based on the data you paste in, or do you pick it yourself first? Either way, the "fast online" angle is a real gap. Spreadsheet chart editors are slow and ugly, so a clean quick web option is genuinely useful for anyone dropping a chart into a deck or a blog post.


Love the focus on visibility and distribution. At Galviq, we help companies discover the right B2B events, trade shows and networking opportunities 👉 https://galviq.com/ I see strong partnership potential here. Open to connecting!
Premium Products


Sponsors
BuyAwards
View all
Awards
View allMakers

Makers
Comments
The description clearly explains what MakeGraph does and the pain point it addresses. However, it could be even more compelling by emphasizing the end benefit to users (such as saving time or creating professional charts effortlessly) and mentioning a few standout features that differentiate it from other charting tools.
Love that this lowers the barrier for non designers. Most charting tools assume you already know which chart type fits your data, which is where people actually get stuck. Does MakeGraph suggest a chart type based on the data you paste in, or do you pick it yourself first? Either way, the "fast online" angle is a real gap. Spreadsheet chart editors are slow and ugly, so a clean quick web option is genuinely useful for anyone dropping a chart into a deck or a blog post.
Love the focus on visibility and distribution. At Galviq, we help companies discover the right B2B events, trade shows and networking opportunities 👉 https://galviq.com/ I see strong partnership potential here. Open to connecting!
Premium Products
New to Fazier?

Find your next favorite product or submit your own. Made by @FalakDigital.
Copyright ©2025. All Rights Reserved