
Make Infographic AI
ai, ai charts, ai infographic, infographic maker
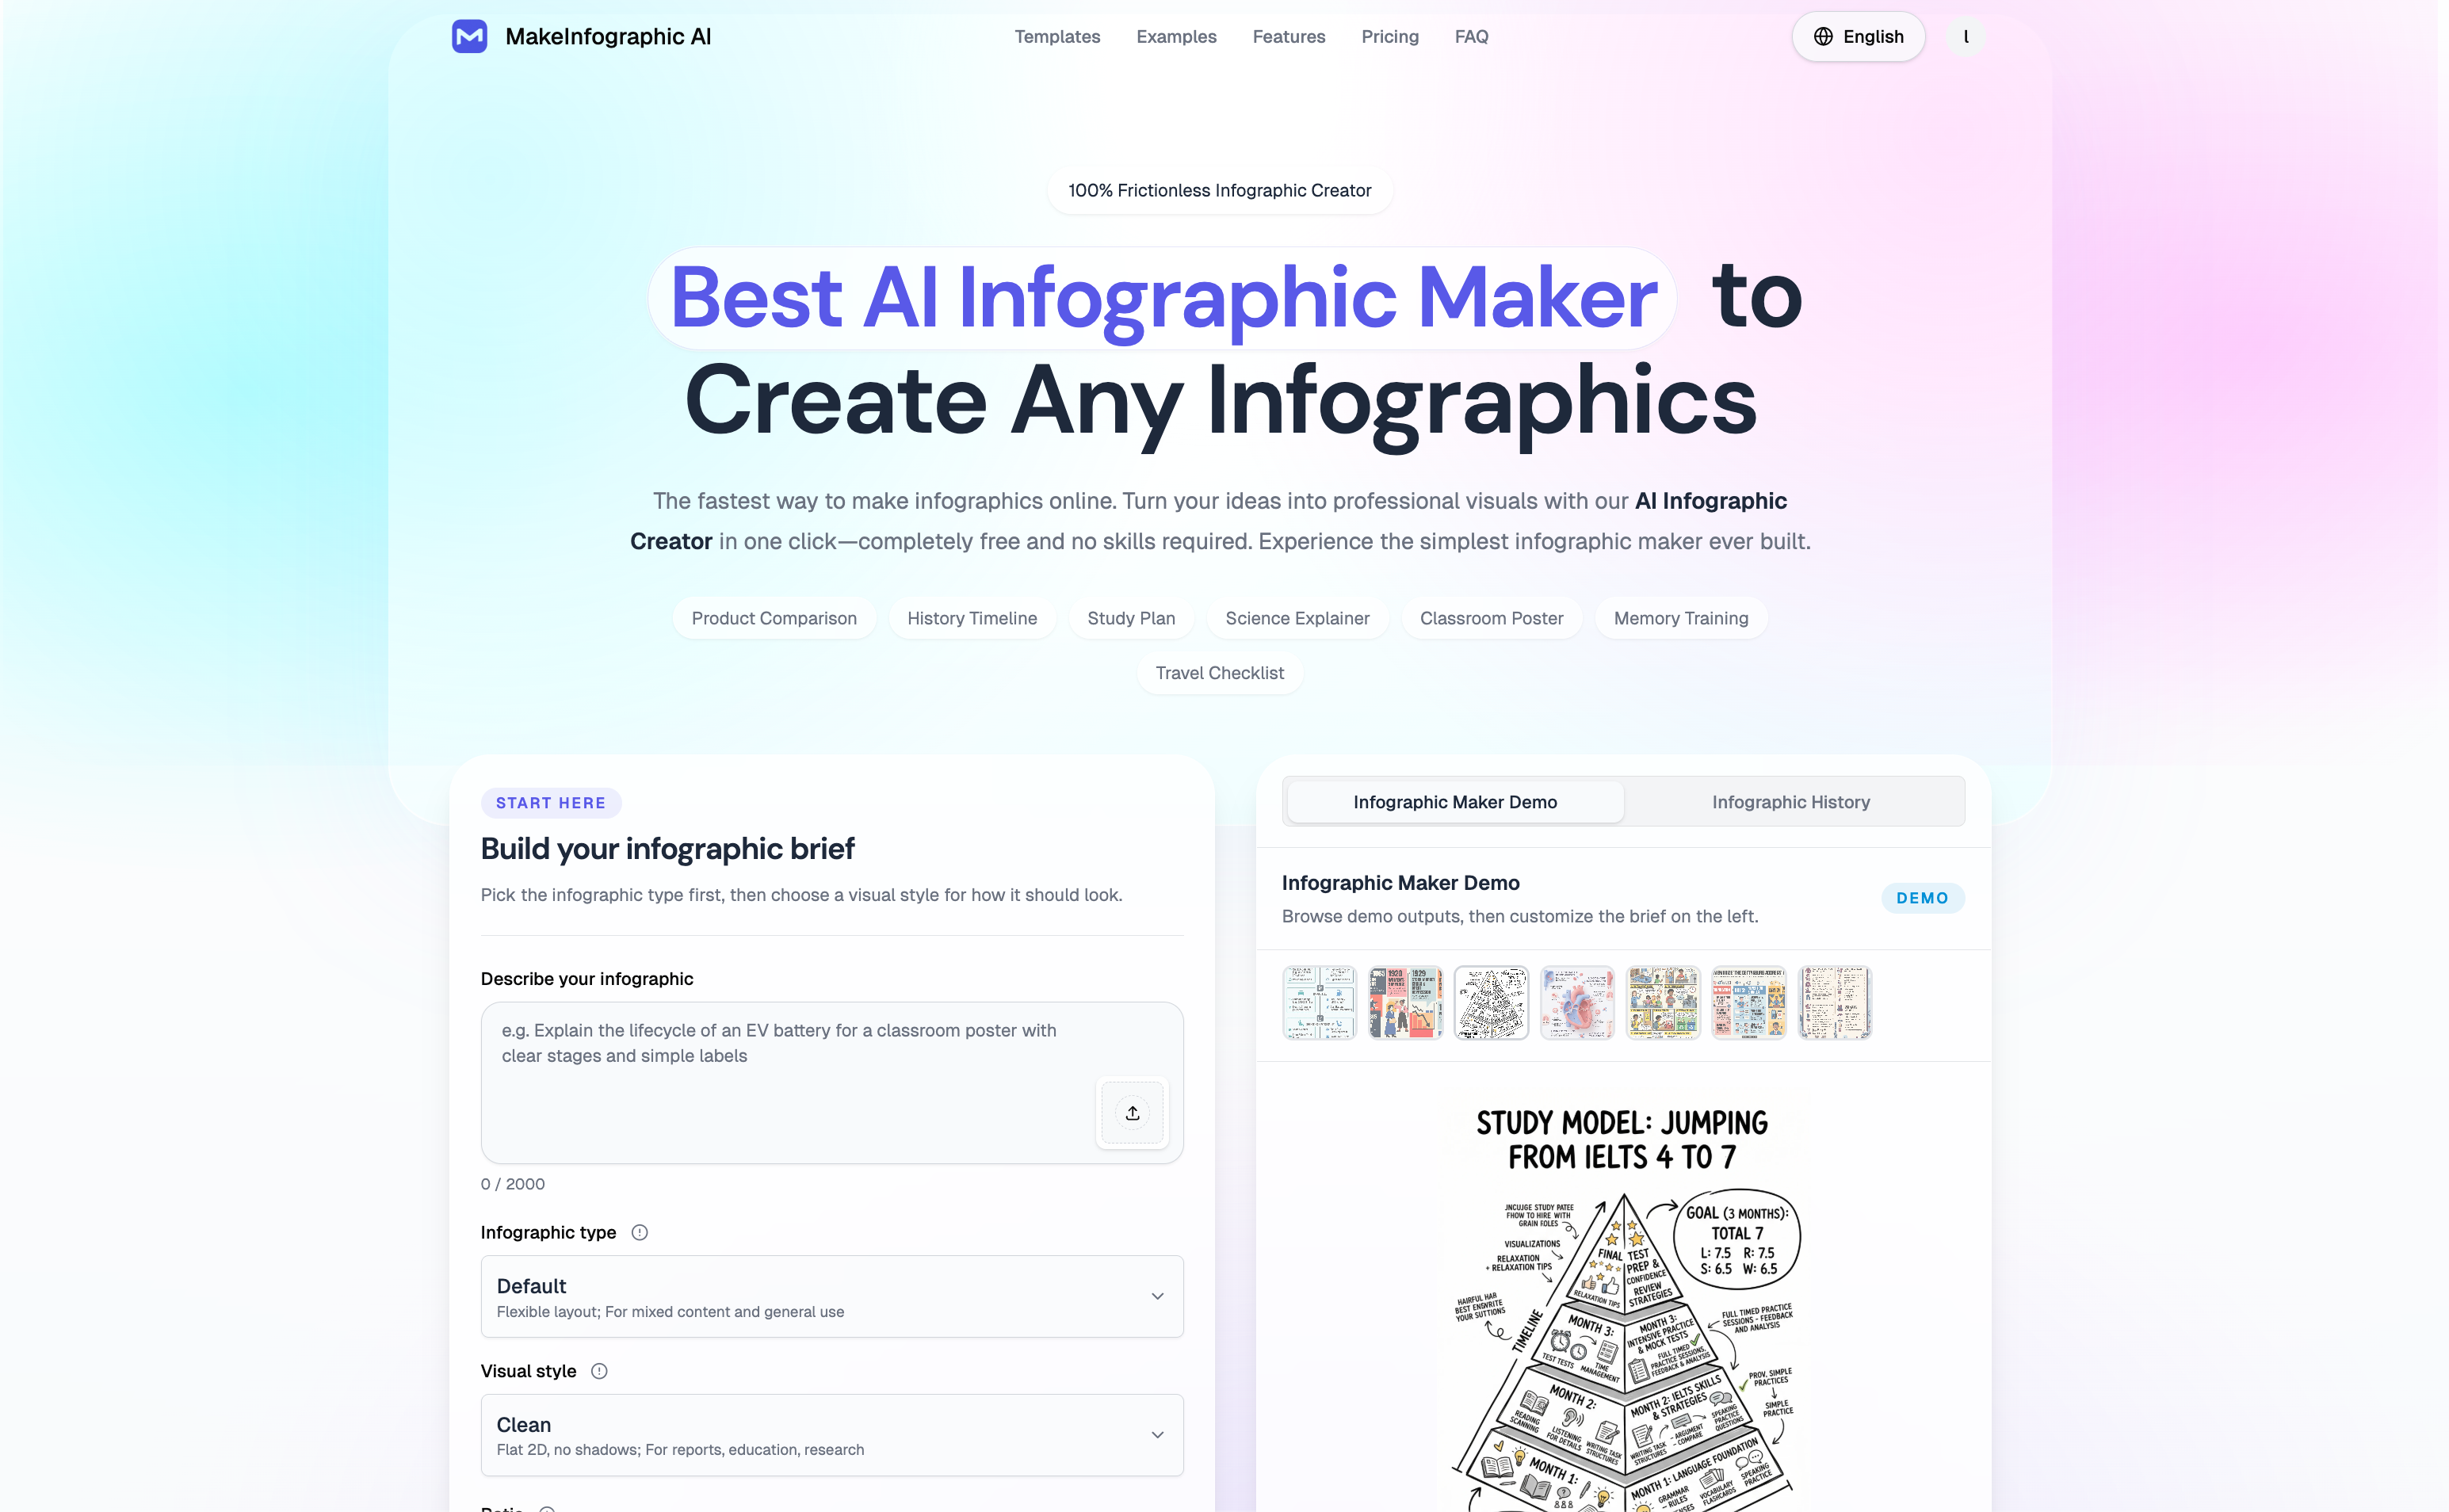
MakeInfographic.ai is an AI infographic generator that lets you create professional visuals instantly—without even needing to log in. You can start right away, enter your content, and watch it turn into a clean, well-structured infographic in seconds.
Designed for speed and simplicity, the tool removes the hassle of traditional design. New users also get free credits to explore its features, making it easy to try before committing. Compared to platforms like Canva or Venngage, it focuses on automation and efficiency, helping you skip manual editing and go straight to results.
Whether you’re creating content for work, school, or social media, MakeInfographic.ai makes visual storytelling faster, easier, and more accessible.
Features
MakeInfographic.ai is a feature-rich AI infographic generator that lets you create high-quality visuals instantly—without requiring login. You can start using it right away, making it one of the most accessible tools for quick content creation.
It offers powerful features such as automatic text-to-infographic generation, multiple layout types (including timelines, comparisons, and flowcharts), built-in AI charts, and flexible visual styles. The platform is designed to transform raw ideas or data into structured, visually appealing graphics with minimal effort. You also get free credits as a new user, allowing you to explore its capabilities immediately.
Compared to traditional tools like Canva or Venngage, MakeInfographic.ai focuses on speed, automation, and ease of use. Instead of manually designing each element, you can generate complete infographics in seconds, making it ideal for anyone who values efficiency without sacrificing quality.
Use Cases
1. Social Media Content Creation
Quickly turn ideas or tips into eye-catching infographics for platforms like Instagram, LinkedIn, or Twitter, helping boost engagement and shares.
2. Business Presentations
Create clean visual slides or infographic-style summaries to explain strategies, data, or processes more effectively during meetings.
3. Educational Materials
Teachers and students can convert complex topics into simple visuals, making learning and explanations easier to understand.
4. Marketing & Content Marketing
Turn blog posts, reports, or product information into visual content that attracts more attention and improves readability.
5. Data Visualization
Transform raw data into charts and infographic formats, making insights clearer and more impactful.
6. Startup & Small Team Use
Generate professional visuals quickly without hiring designers, saving both time and cost.
7. Personal Projects
Create visually appealing resumes, guides, or summaries for personal use or sharing online.
Sponsors
Buy
Comments

Premium Products


Find your next favorite product or submit your own. Made by @FalakDigital.
Copyright ©2025. All Rights Reserved