
Geckoscreener
Worlds first user friendly crypto screener
GeckoScreener is a crypto screener and strategy backtester. It watches 100+ cryptocurrencies in real time and puts RSI, MACD, ADX, EMA, volume and price action in a single sortable table that refreshes every 60 seconds. 19 candlestick pattern detectors run on every coin, so a hammer or an engulfing candle shows up as a filter, not something you hunt for chart by chart.
The strategy builder takes plain language. Type something like "oversold coins crossing above the 20 EMA on rising volume" and it writes the query for you: rsi(14) < 35 AND close crossed_above ema(20) AND volume > volume[1] * 1.5. No syntax to learn. Save the criteria as a reusable strategy with entry, exit, stop loss and take profit rules.
Then backtest it. (feature coming soon). Any strategy runs across the top 100 coins over up to 9 months of history, in portfolio or per-coin mode, with full equity curves and trade history, so you see how it would have done before risking a dollar. Strategies can be shared with the community, and there is a Telegram group for users. Free to sign up and use.
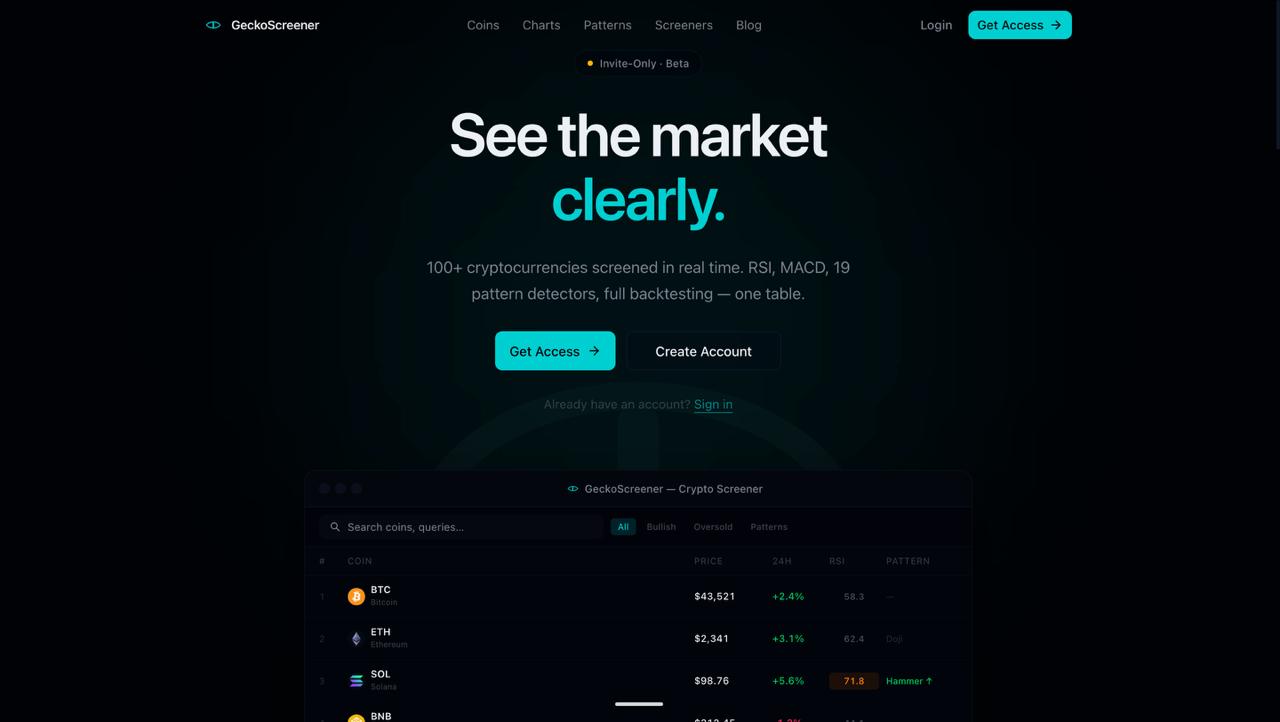
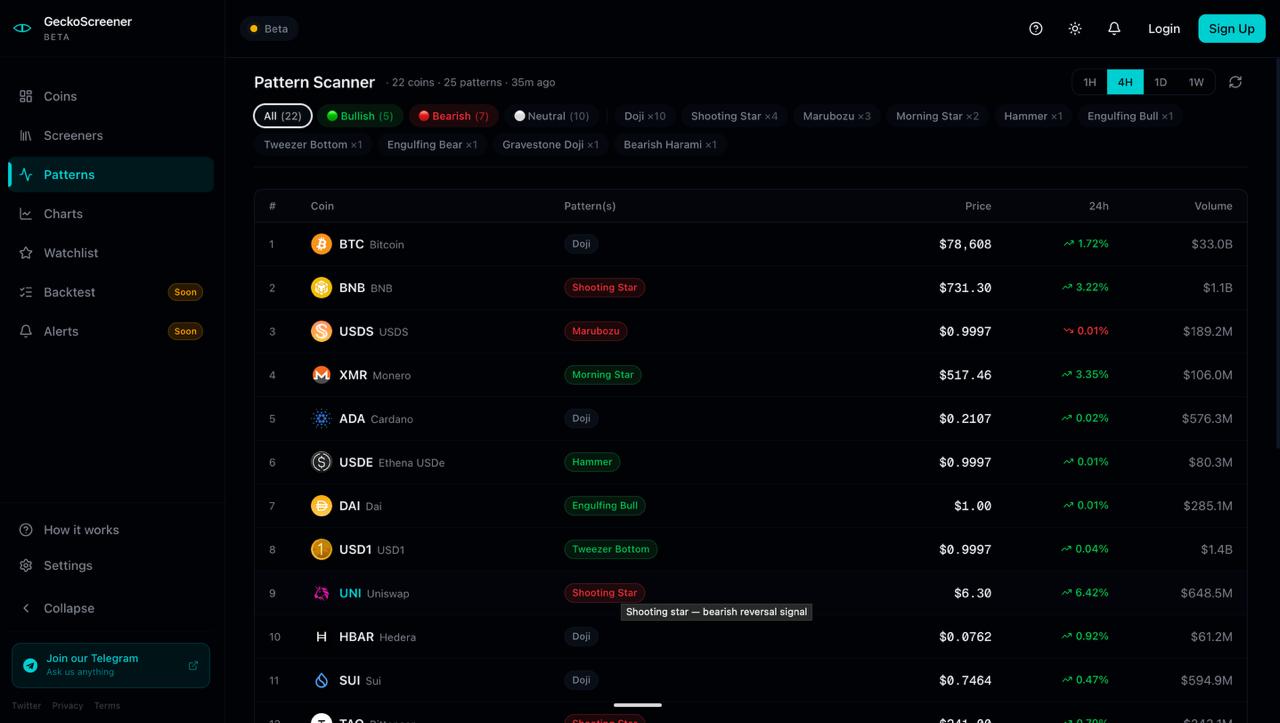
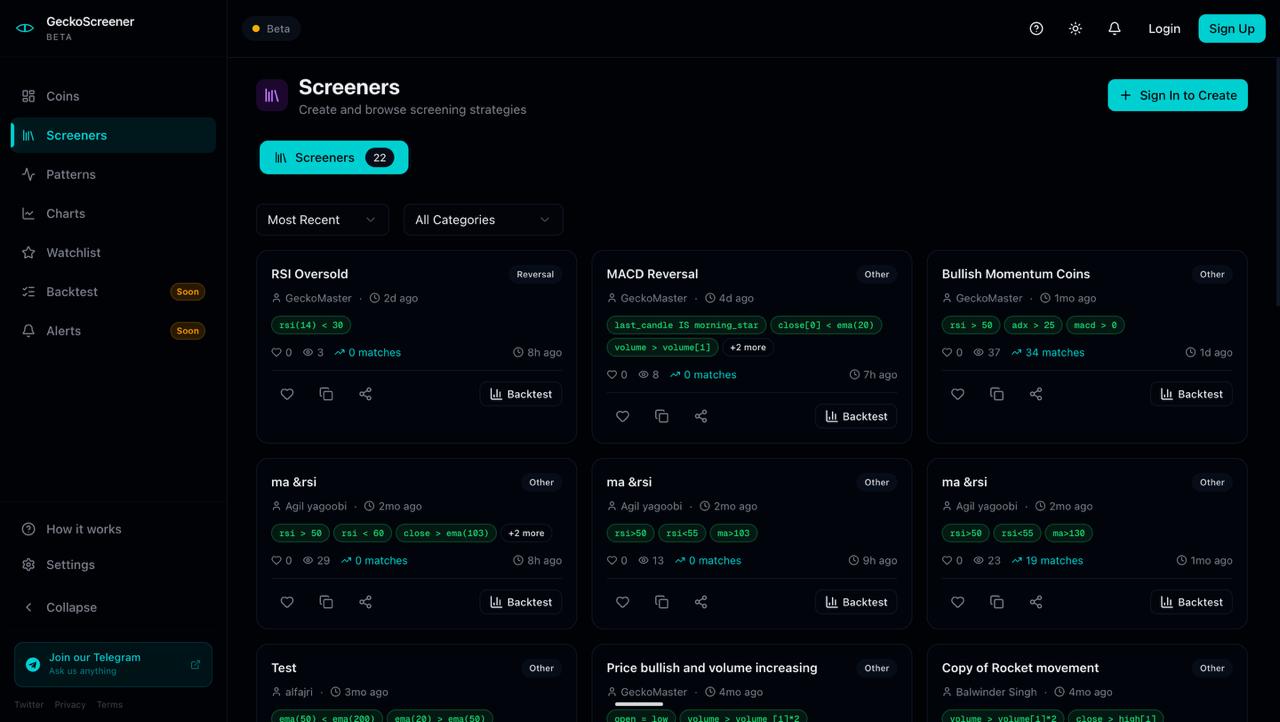
Features
- Live screener across 100+ cryptocurrencies, refreshed every 60 seconds
- Filters for RSI, MACD, ADX, EMA, volume and price action in one sortable table
- 19 candlestick pattern detectors that run as filters on every coin
- Plain-English strategy builder that converts your idea into a runnable query
- Saved strategies with entry, exit, stop loss and take profit conditions
- Backtesting over up to 9 months of history, portfolio or per-coin mode (coming soon)
- Full equity curves and trade history for every backtest
- Community strategy sharing and a Telegram group
- Quick views for bullish, oversold and pattern-matched coins
- Free tier with open signup
Use Cases
- Find oversold coins at a glance: filter RSI below 30 across the whole market instead of opening 100 charts
- Catch volume breakouts as they start, with volume compared against the previous candle
- Spot reversal setups by screening for hammers, engulfing candles and other patterns on the current bar
- Turn a trading idea into a rule set in seconds, without learning a query language
- Validate a strategy before funding it, by running it over months of data and reading the equity curve
- Compare how the same rules perform across the top 100 coins versus a single asset
- Build a daily watchlist from saved screens rather than rebuilding filters each morning
- Share a strategy with a trading group and let them run it on live data

Comments

Premium Products

































Find your next favorite product or submit your own. Made by @FalakDigital.
Copyright ©2026. All Rights Reserved