
FinScope
Drawdown-first dashboard for 813 US stocks & ETFs — free
Most investing tools lead with returns, which quietly hides how painful the ride was. FinScope flips it: drawdown first. Type any of 813 US stocks or ETFs and instantly see the worst it ever fell, how long it took to recover, and how it behaved in the dot-com crash, 2008, 2018, COVID, and the 2022 bear market. There's an ETF overlap checker (how redundant are two funds, really?), a portfolio drawdown + correlation tool, risk metrics (Sharpe/Sortino/Calmar/Ulcer/beta), a drawdown screener, and rankings. Free, no login, no paywall. Daily data from Yahoo Finance. Built for anyone who wants to size up tail risk before they buy.
Features
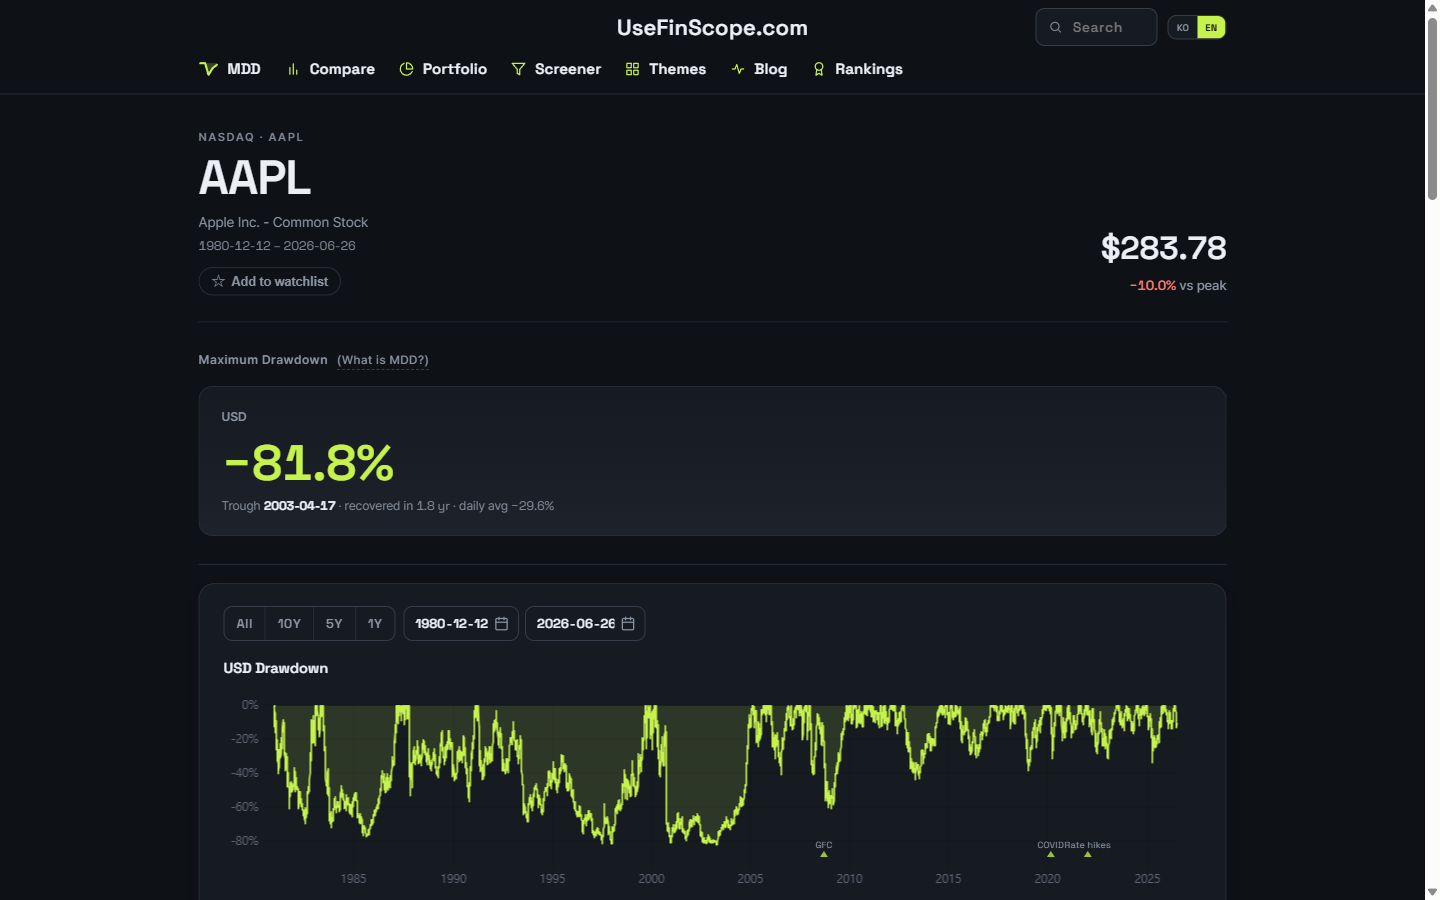
Maximum drawdown & underwater chart for any of 813 US stocks and ETFs
Crisis-by-crisis loss & recovery cards (dot-com, 2008, 2018, COVID, 2022)
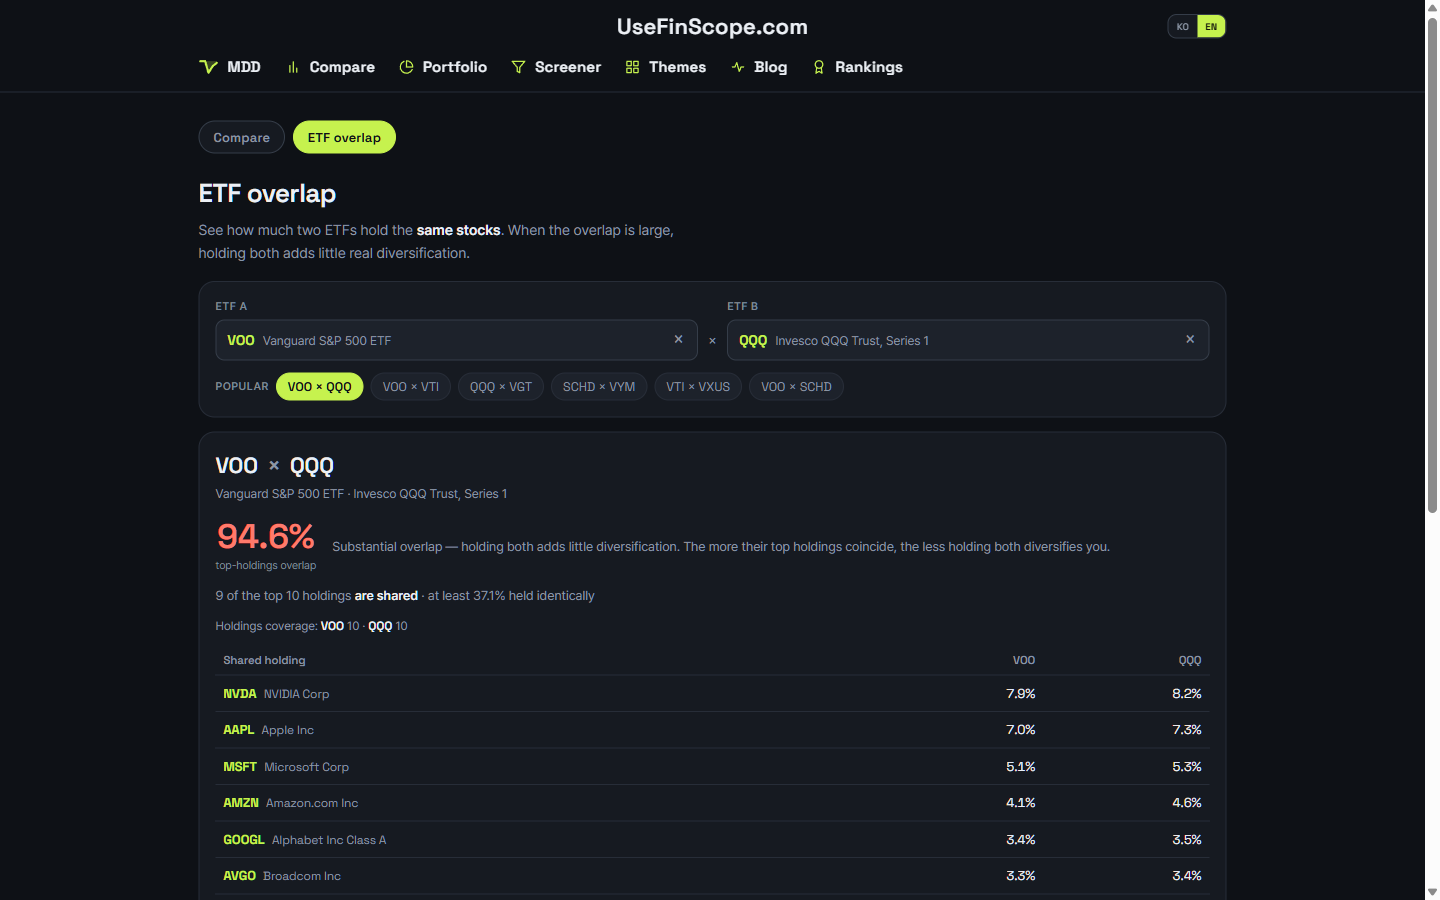
ETF overlap checker — true shared top holdings between two funds
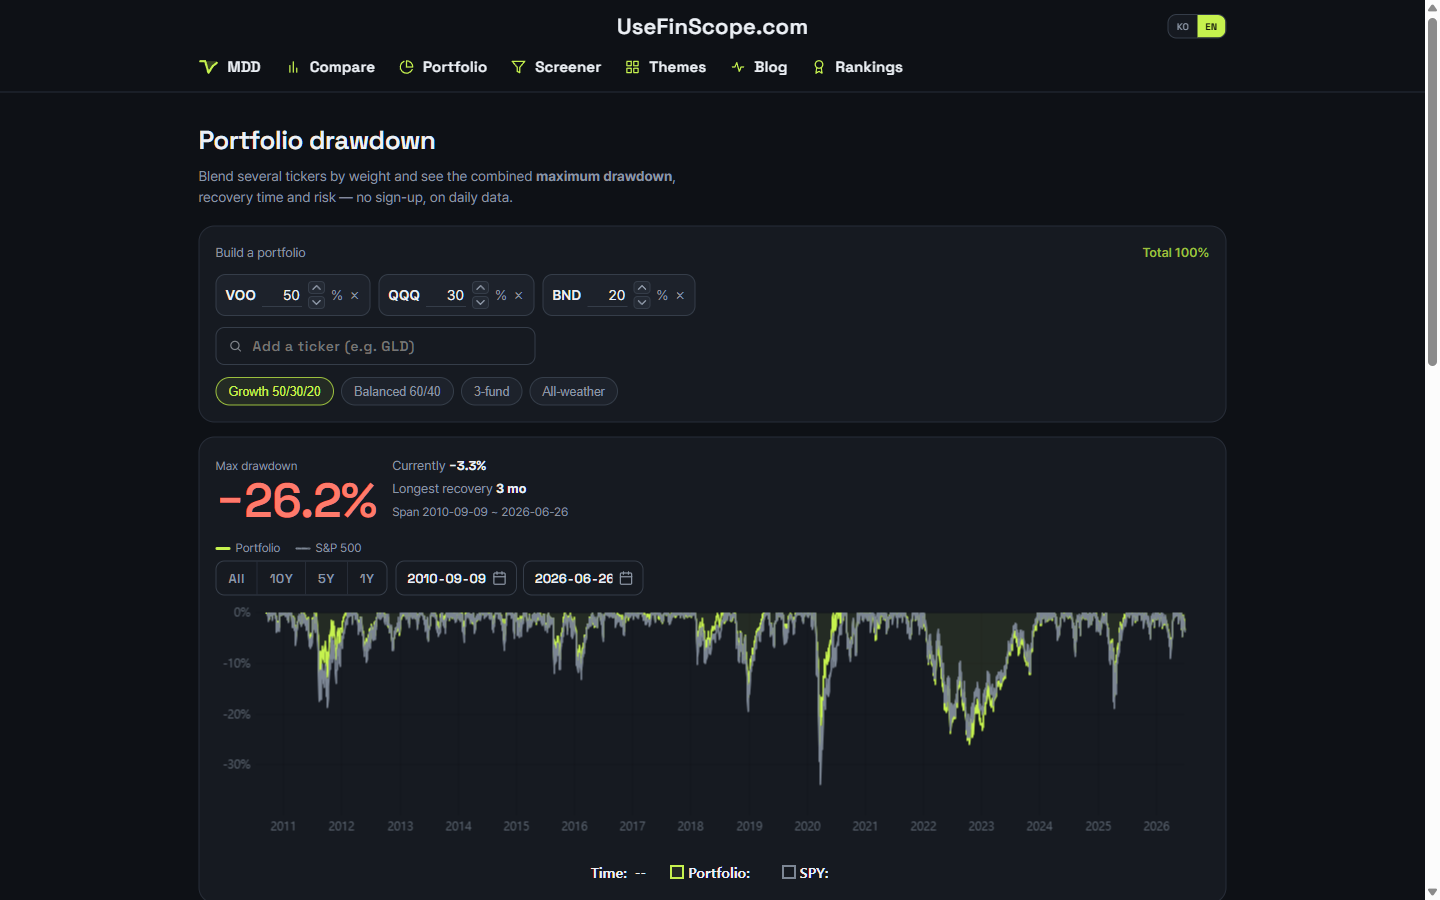
Portfolio drawdown with correlation / redundancy insight
Risk metrics: Sharpe, Sortino, Calmar, Ulcer Index, beta
Drawdown screener, rankings, themes, and two-ticker compare
Free, no login, bilingual (EN/KO)

Comments


Hey Fazier! I built FinScope because every investing site I tried leads with returns - and quietly buries the one thing that actually makes people panic-sell at the bottom: the drawdown. How far did it fall? How long did it take to recover? How did it behave in the dot-com crash, 2008, COVID, and 2022? FinScope answers that for 813 US stocks and ETFs - free, no login. Type a ticker and you get the max drawdown, underwater chart, recovery time, and crisis-by-crisis loss/recovery cards. There's also an ETF overlap checker (how redundant are two funds, really?), a portfolio drawdown + correlation tool, and risk metrics (Sharpe / Sortino / Calmar / Ulcer / beta). Data refreshes daily from Yahoo Finance. I'd love your feedback on what to add next. Thanks for checking it out!
Premium Products


Sponsors
BuyMakers
Makers
Comments
Hey Fazier! I built FinScope because every investing site I tried leads with returns - and quietly buries the one thing that actually makes people panic-sell at the bottom: the drawdown. How far did it fall? How long did it take to recover? How did it behave in the dot-com crash, 2008, COVID, and 2022? FinScope answers that for 813 US stocks and ETFs - free, no login. Type a ticker and you get the max drawdown, underwater chart, recovery time, and crisis-by-crisis loss/recovery cards. There's also an ETF overlap checker (how redundant are two funds, really?), a portfolio drawdown + correlation tool, and risk metrics (Sharpe / Sortino / Calmar / Ulcer / beta). Data refreshes daily from Yahoo Finance. I'd love your feedback on what to add next. Thanks for checking it out!
Premium Products
New to Fazier?

Find your next favorite product or submit your own. Made by @FalakDigital.
Copyright ©2025. All Rights Reserved