
Excel2Dashboard
Turn any spreadsheet into a live, shareable dashboard
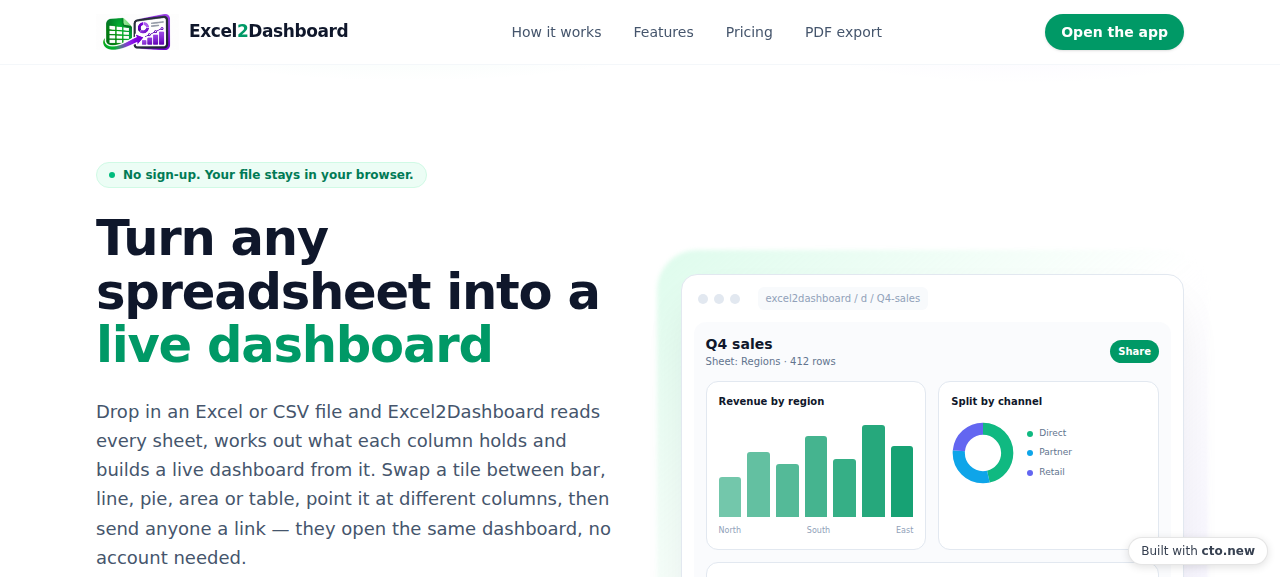
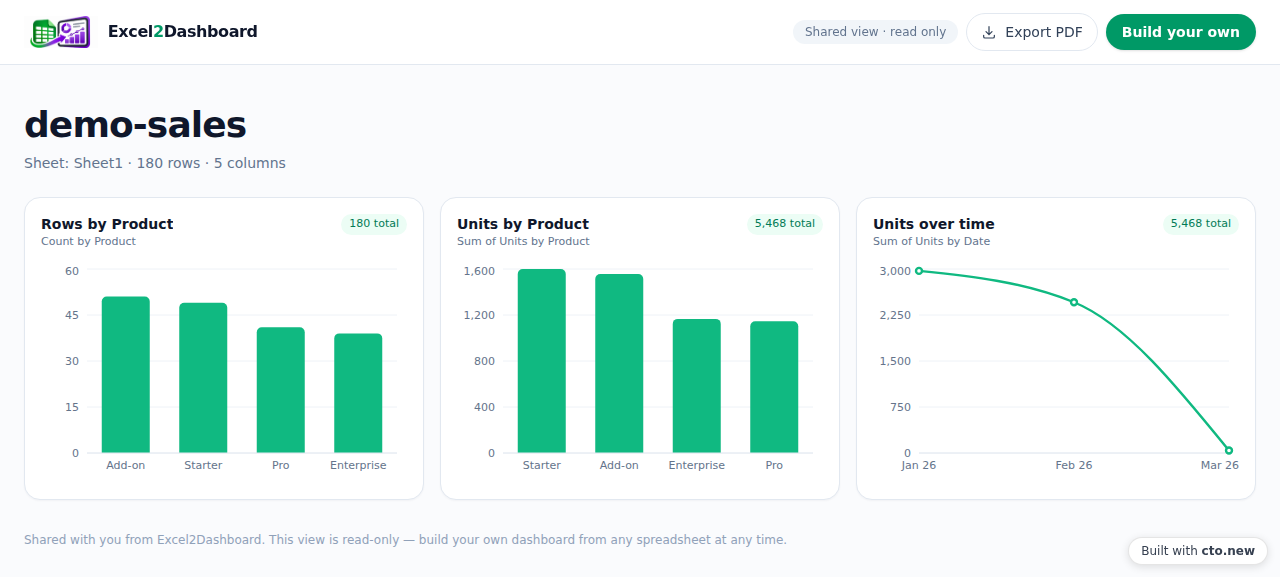
Excel2Dashboard turns a spreadsheet into a dashboard you can actually show someone. If you are the person who built the workbook - in ops, finance, sales, or running a small business - you usually need to put that data in front of somebody else. The usual options are exporting a pile of charts into slides, or learning a BI tool and buying a seat. Excel2Dashboard is neither. Drop in an Excel or CSV file and it reads every sheet, works out what each column holds, and builds a live dashboard from it: swap any tile between bar, line, pie, area and table, point it at different columns, and the charts redraw as you go. When it looks right, share it. The primary share action creates a short link, and anyone who opens it sees the same dashboard, read-only, with no account and nothing to install. There is also one-click PDF export when someone needs a file rather than a link. Two things are deliberate. There is no sign-up - you open the site and start. And your file is never uploaded: parsing happens in your browser, so the spreadsheet stays on your machine. It is free for files under 10MB, which covers most everyday workbooks. Files 10MB and above need the 9 dollars a month plan, paid through Stripe and managed from a customer portal. On very large sheets, charts are built from the first 20,000 rows of each sheet and the app tells you so rather than pretending otherwise.
Features
Reads every sheet in an Excel or CSV file and works out what each column holds
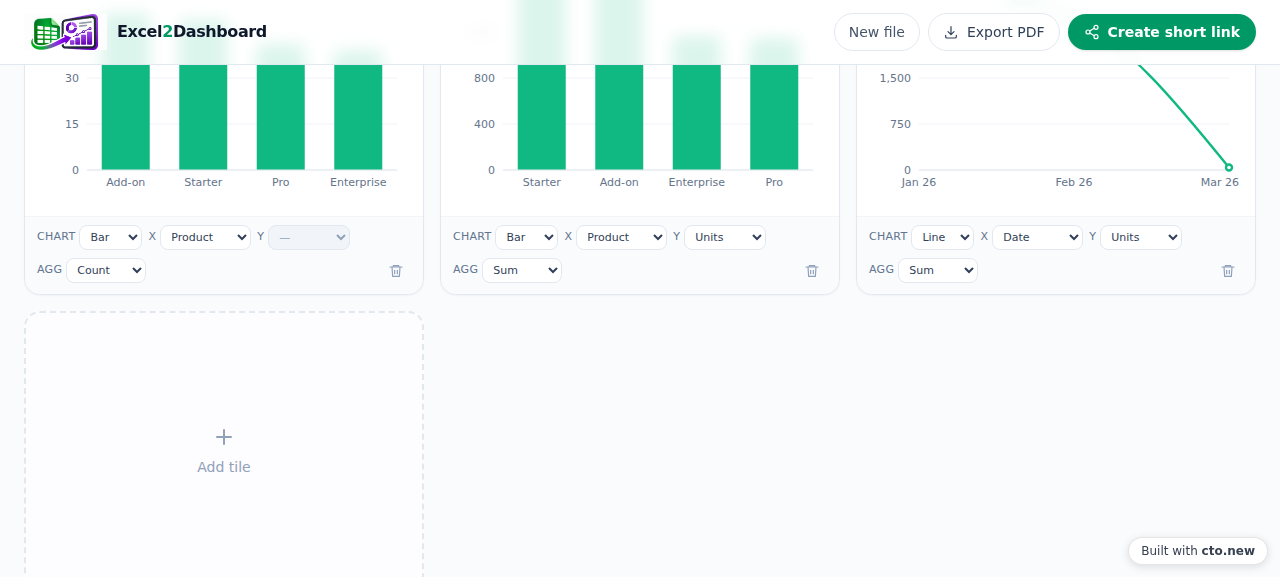
Swap any tile between bar, line, pie, area and table
Point a tile at different columns, or change the aggregation: sum, average, count, min, max
Short share link that opens read-only for anyone, with no account
One-click PDF export of the finished dashboard
The file is parsed in your browser and never uploaded
Free under 10MB, 9 dollars a month for 10MB and above
Use Cases
Ops teams turning a weekly export into something the wider team can actually look at
Finance sharing a month-end summary without emailing the workbook around
Sales putting pipeline numbers in front of people who will never open Excel
Small businesses showing figures to a client or a landlord
Anyone who needs a PDF of the numbers rather than a spreadsheet

Comments

We kept running into the same gap: the person who actually maintains the spreadsheet is rarely the person with a BI licence, and by the time a Power BI or Tableau seat gets approved the question has moved on. Excel2Dashboard takes the file you already have, reads it in the browser, and turns its columns into chart tiles you can re-point at different fields. Then it gives you a link anyone can open - no account - plus a PDF export. Files never leave the browser; only the dashboard numbers are stored when you create a short link. Free for files under 10MB, 9 dollars a month above that. Honest limits: charts read the first 20,000 rows of each sheet, and the size check runs in the browser. If your workbook breaks it, tell us what shape it is - that is the most useful feedback we can get.
Premium Products





















































Sponsors
Buy

Comments
We kept running into the same gap: the person who actually maintains the spreadsheet is rarely the person with a BI licence, and by the time a Power BI or Tableau seat gets approved the question has moved on. Excel2Dashboard takes the file you already have, reads it in the browser, and turns its columns into chart tiles you can re-point at different fields. Then it gives you a link anyone can open - no account - plus a PDF export. Files never leave the browser; only the dashboard numbers are stored when you create a short link. Free for files under 10MB, 9 dollars a month above that. Honest limits: charts read the first 20,000 rows of each sheet, and the size check runs in the browser. If your workbook breaks it, tell us what shape it is - that is the most useful feedback we can get.
Premium Products
New to Fazier?

Find your next favorite product or submit your own. Made by @FalakDigital.
Copyright ©2026. All Rights Reserved