
Charttoolbox
Charttoolbox
Turn CSV and Excel data into clear charts in your browser
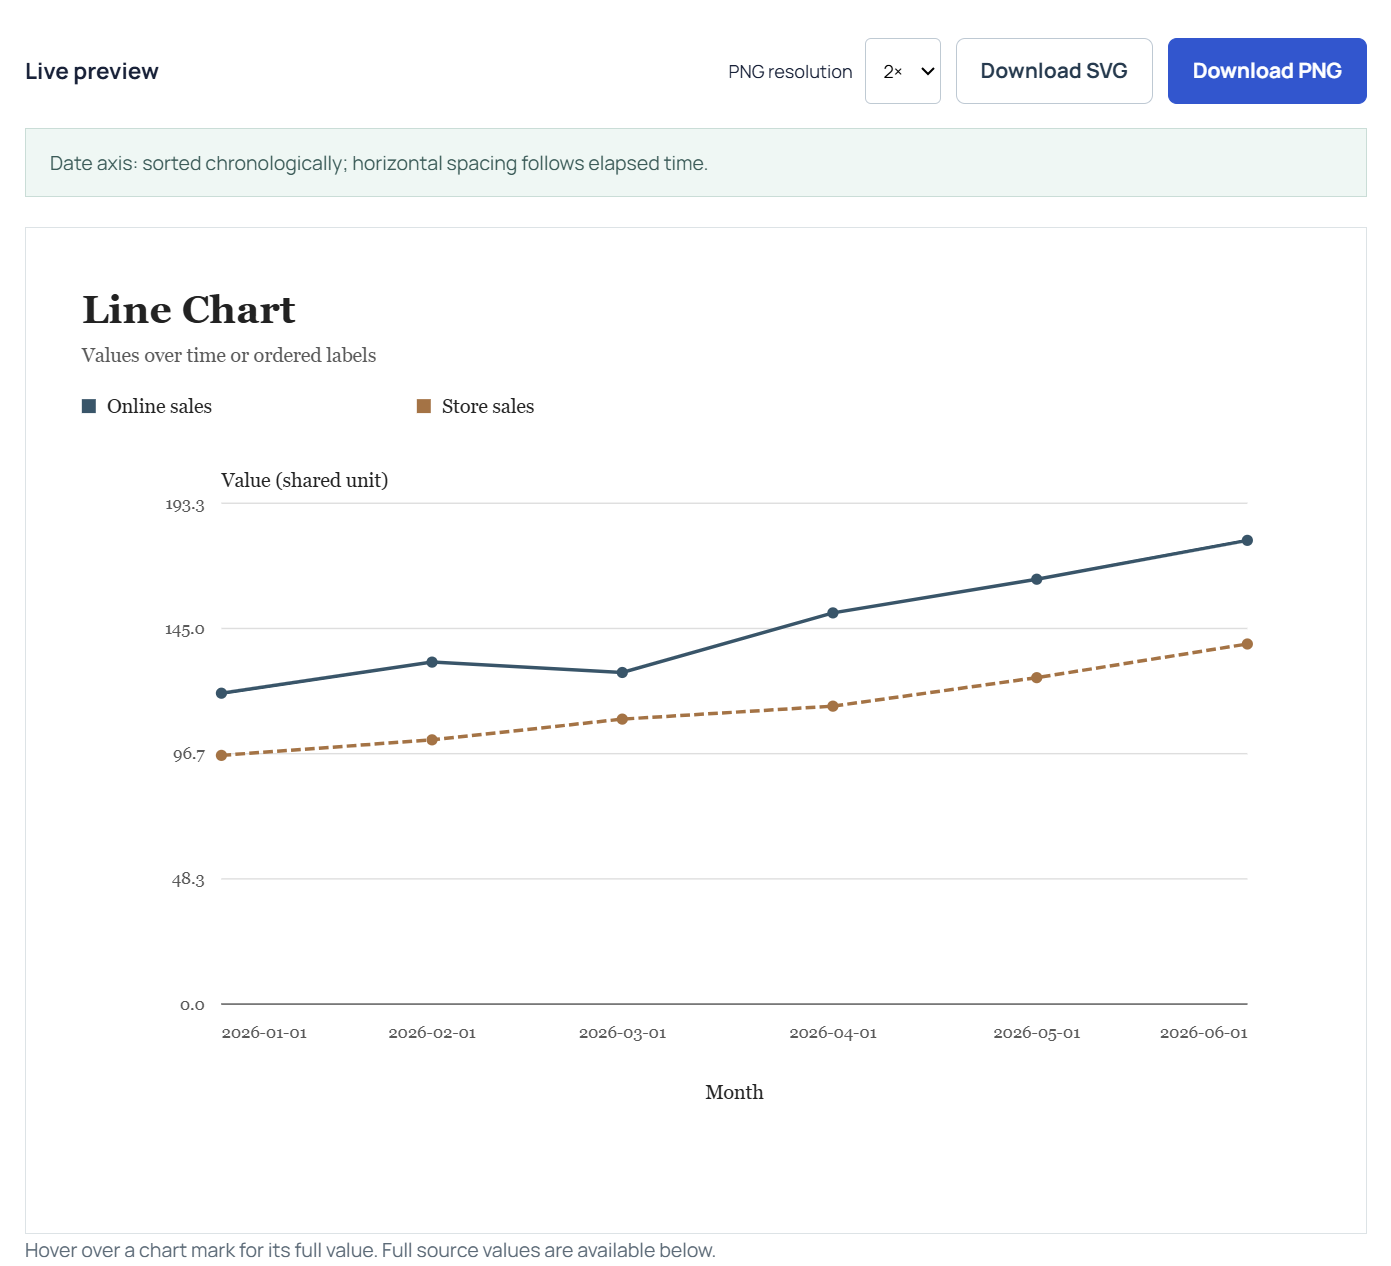
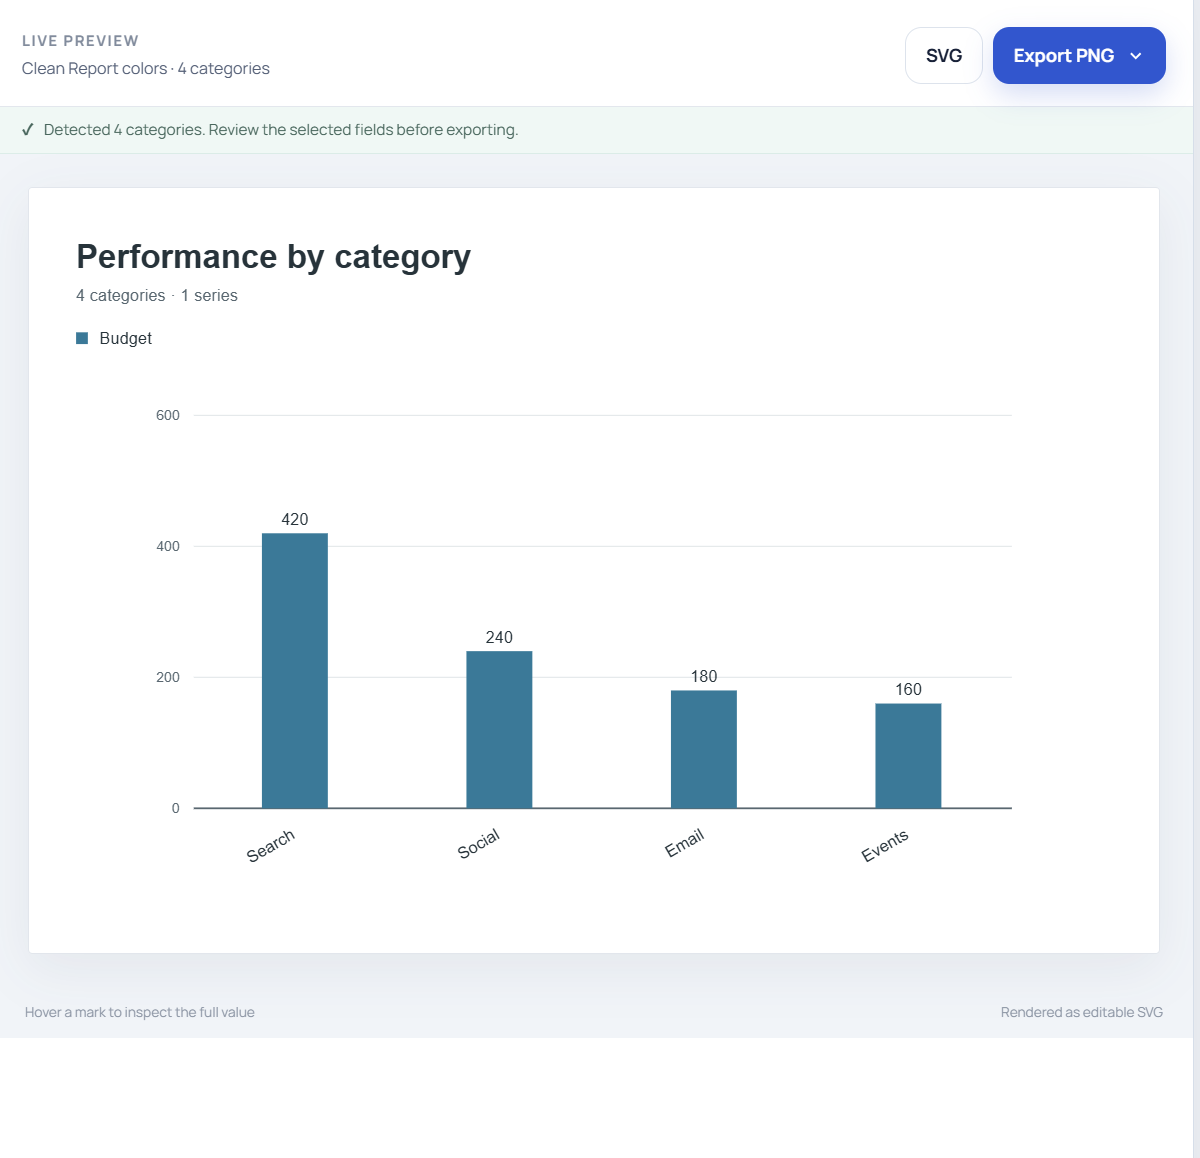
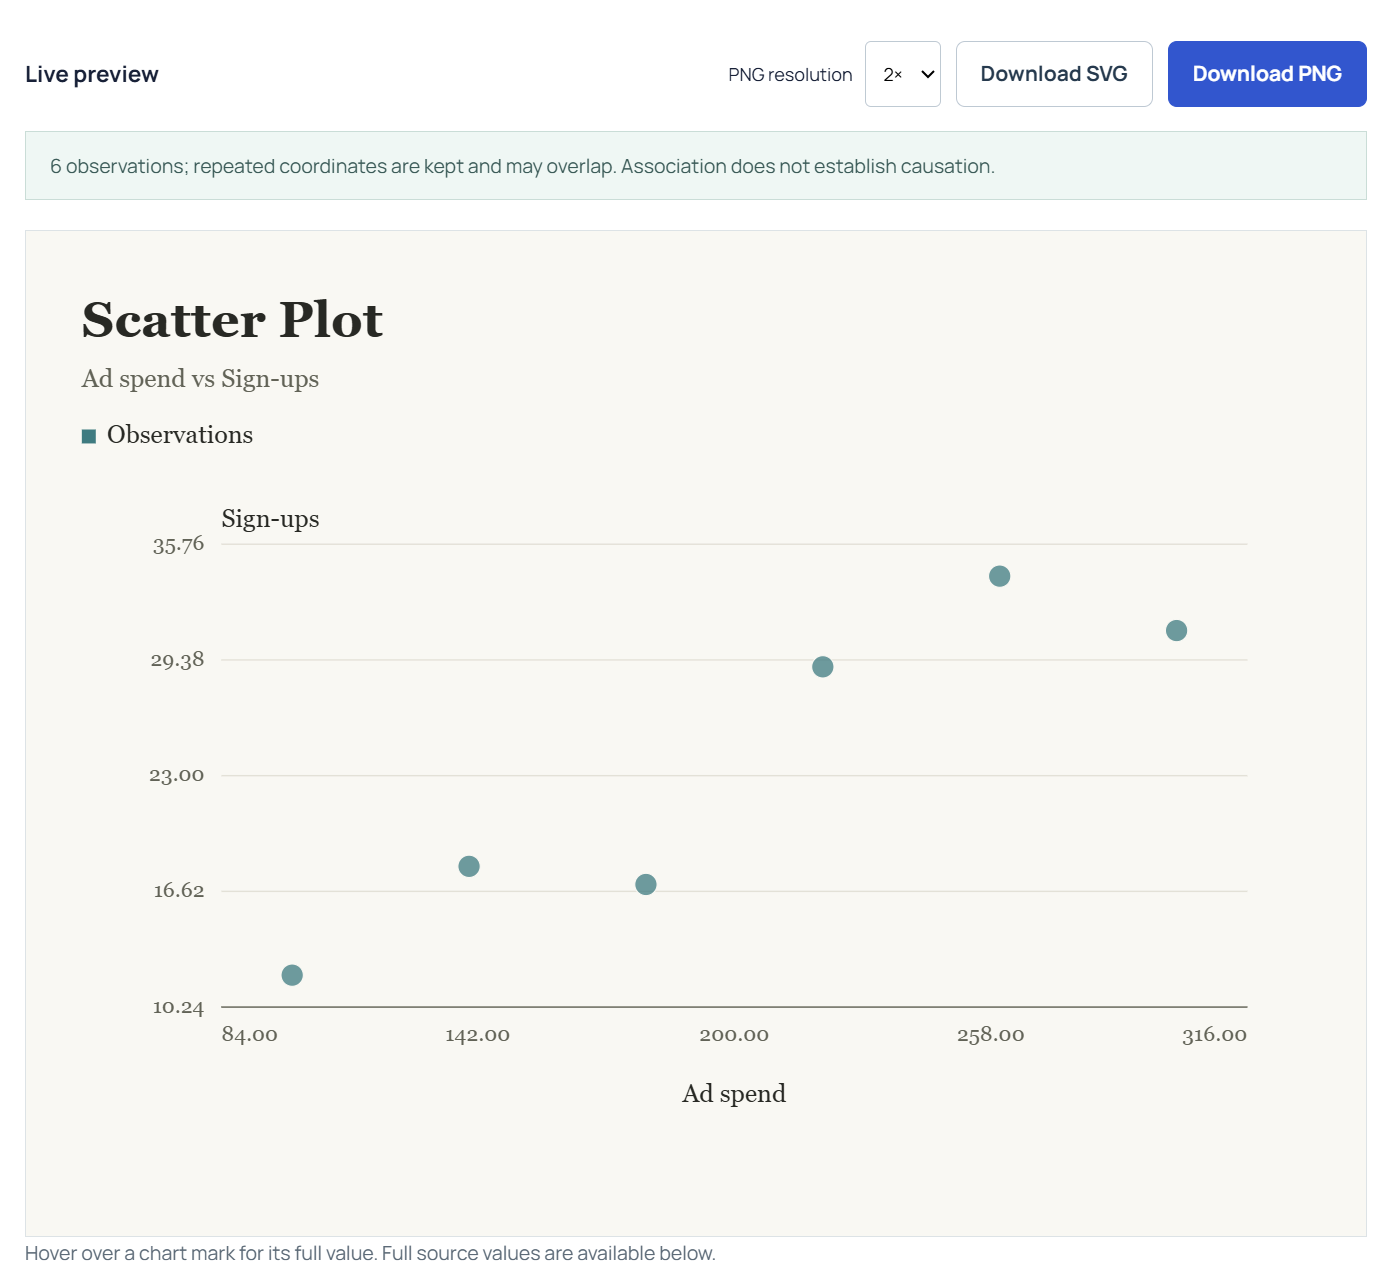
Charttoolbox turns spreadsheet data into charts without setting up a full BI dashboard. Upload a CSV, TSV, XLS, or XLSX file, paste a table, or start with sample data. Choose from heatmaps, pie/donut charts, bar charts, line charts, scatter plots, histograms, and correlation matrices. Adjust the fields and presentation, then export a PNG or SVG. Your spreadsheet contents are processed locally in your browser. The tools are free to use and require no account.

Features
- Create seven types of charts from spreadsheet data.
- Import CSV, TSV, XLS, and XLSX files, or paste a table directly.
- Review and adjust detected fields before generating a chart.
- Customize the chart’s presentation and export PNG or SVG.
- Process spreadsheet contents locally in your browser, with no account required.
Use Cases
- Turn monthly sales figures into a line chart or compare categories with a bar chart.
- Spot patterns across rows and columns with a heatmap.
- Show how a few categories contribute to a whole with a pie or donut chart.
- Explore distributions and relationships with histograms, scatter plots, and correlation matrices.

Comments

Premium Products













































Sponsors
Buy

Makers

AI builder,Vibecoding,Teacher
Makers
AI builder,Vibecoding,Teacher
Comments
Premium Products
New to Fazier?

Find your next favorite product or submit your own. Made by @FalakDigital.
Copyright ©2026. All Rights Reserved