
BeCharts
Online chart maker for reports and dashboards
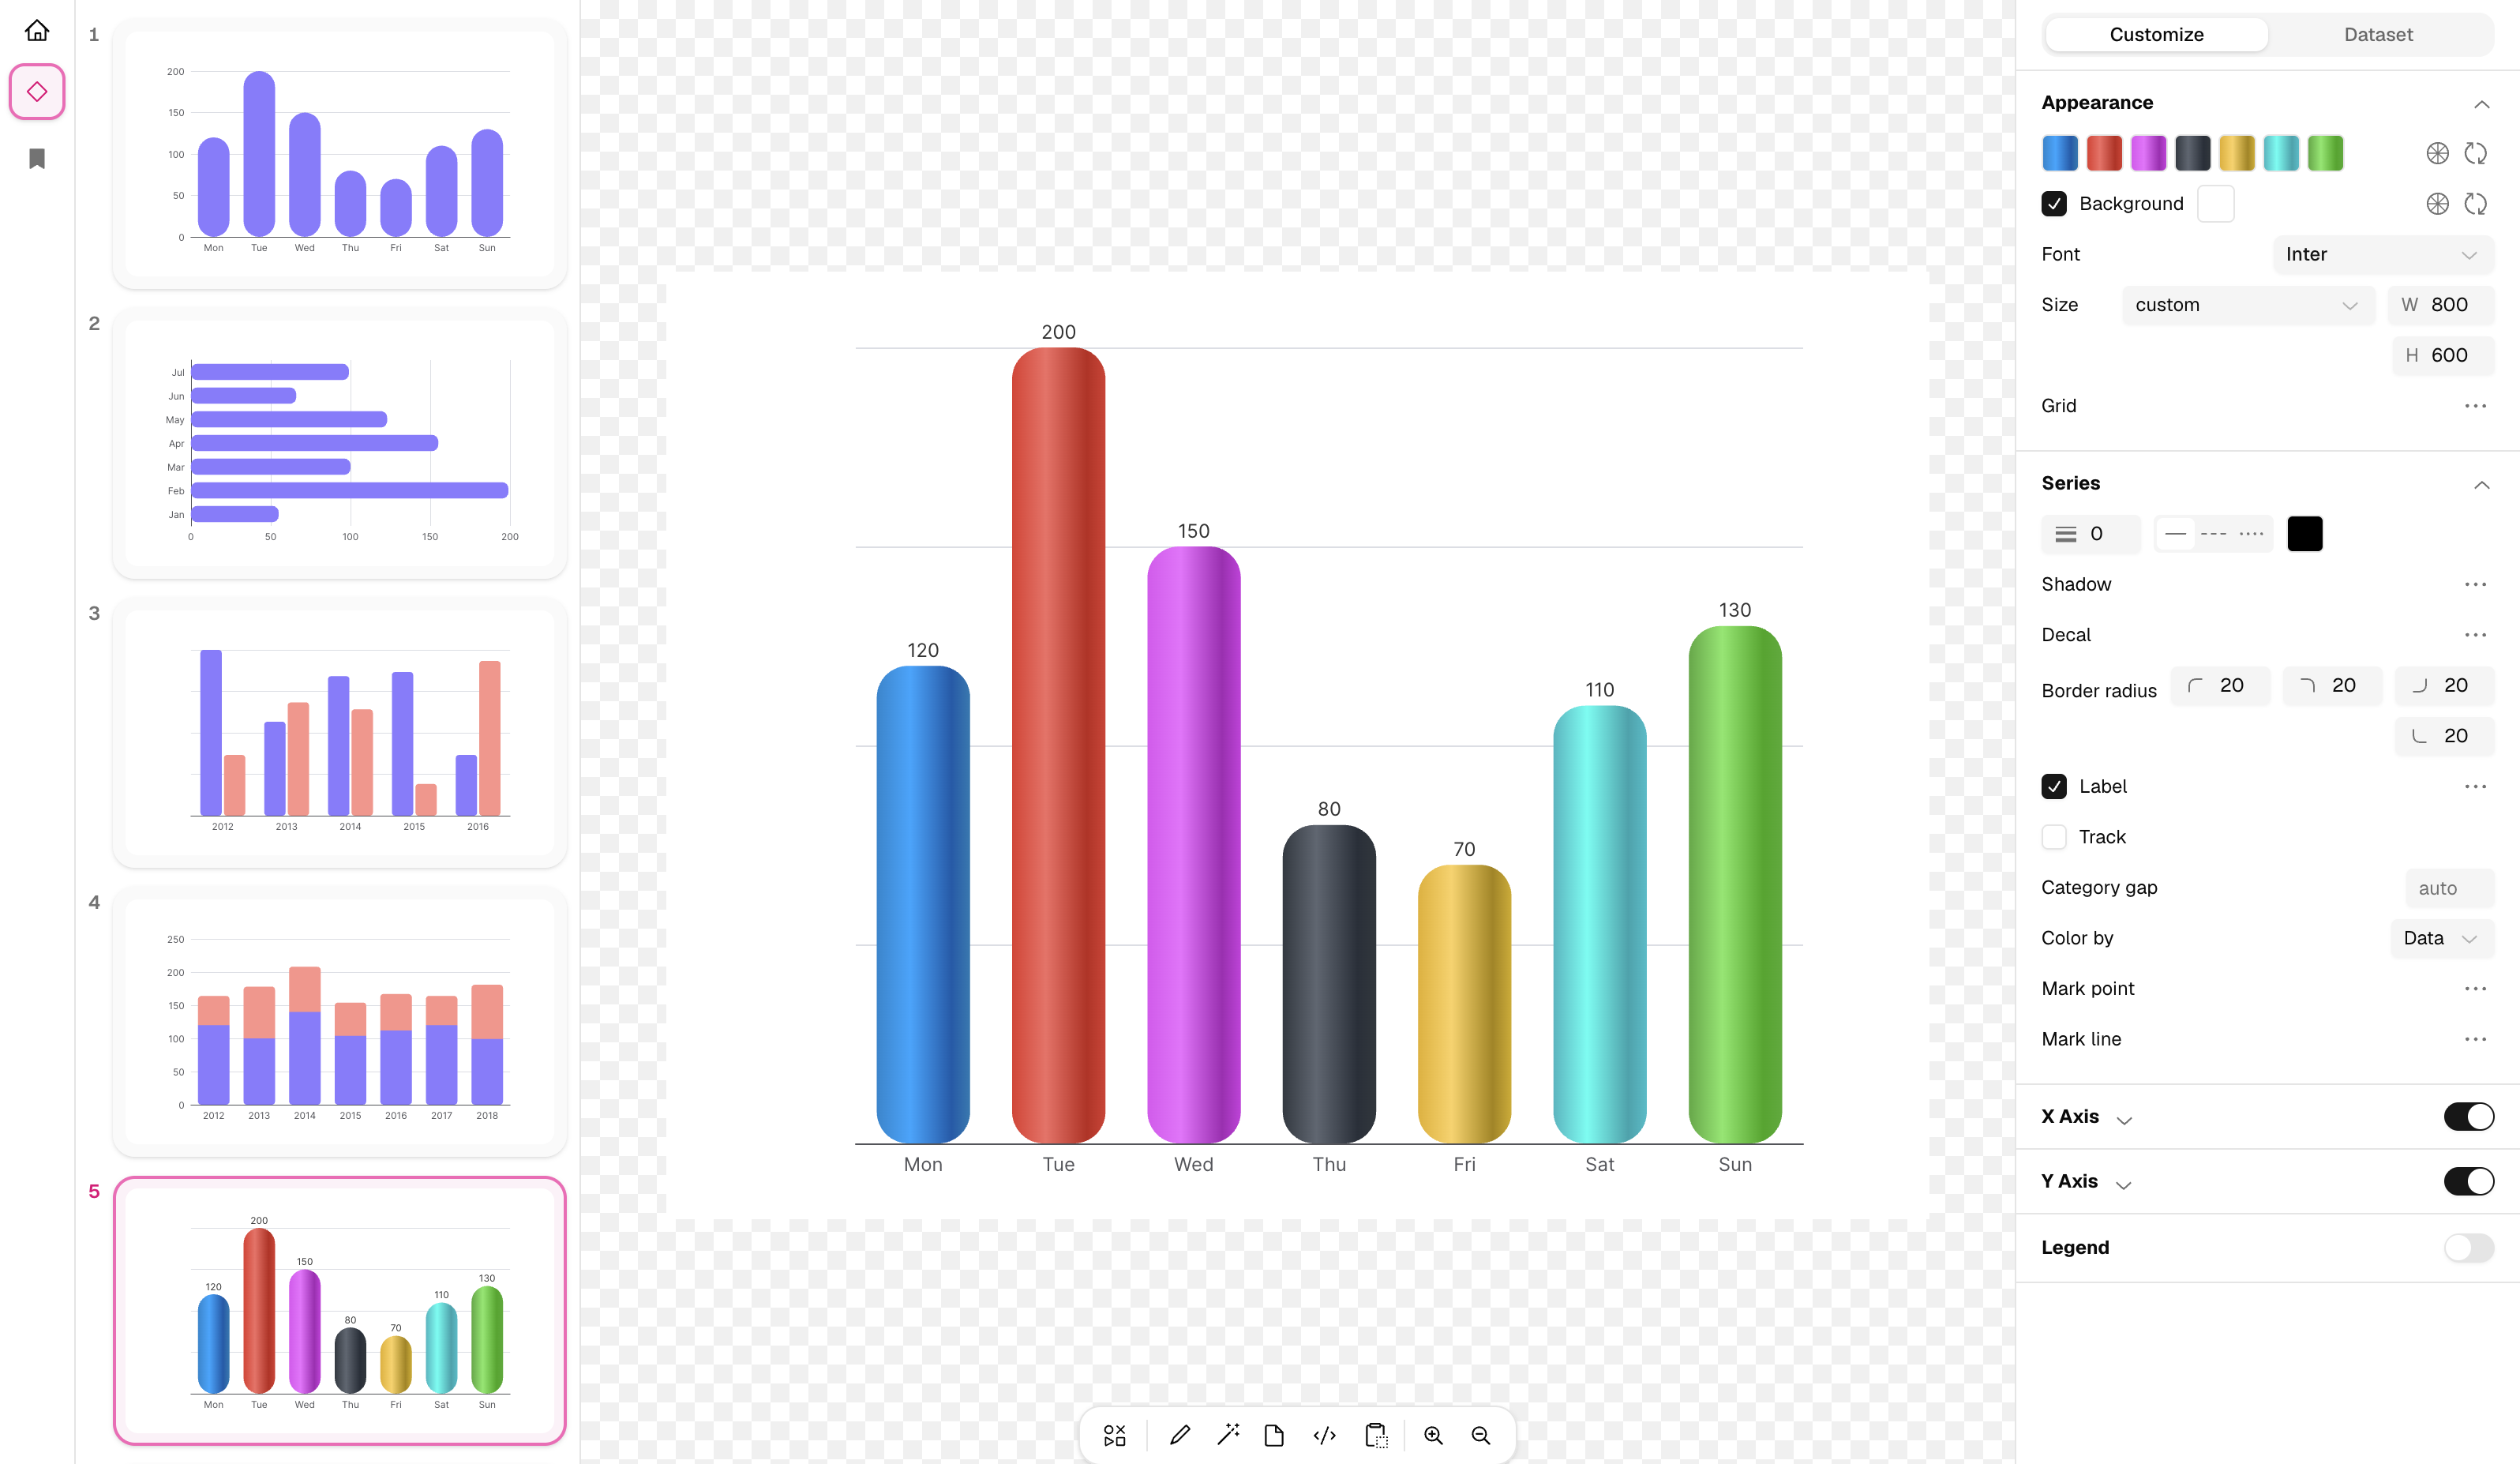
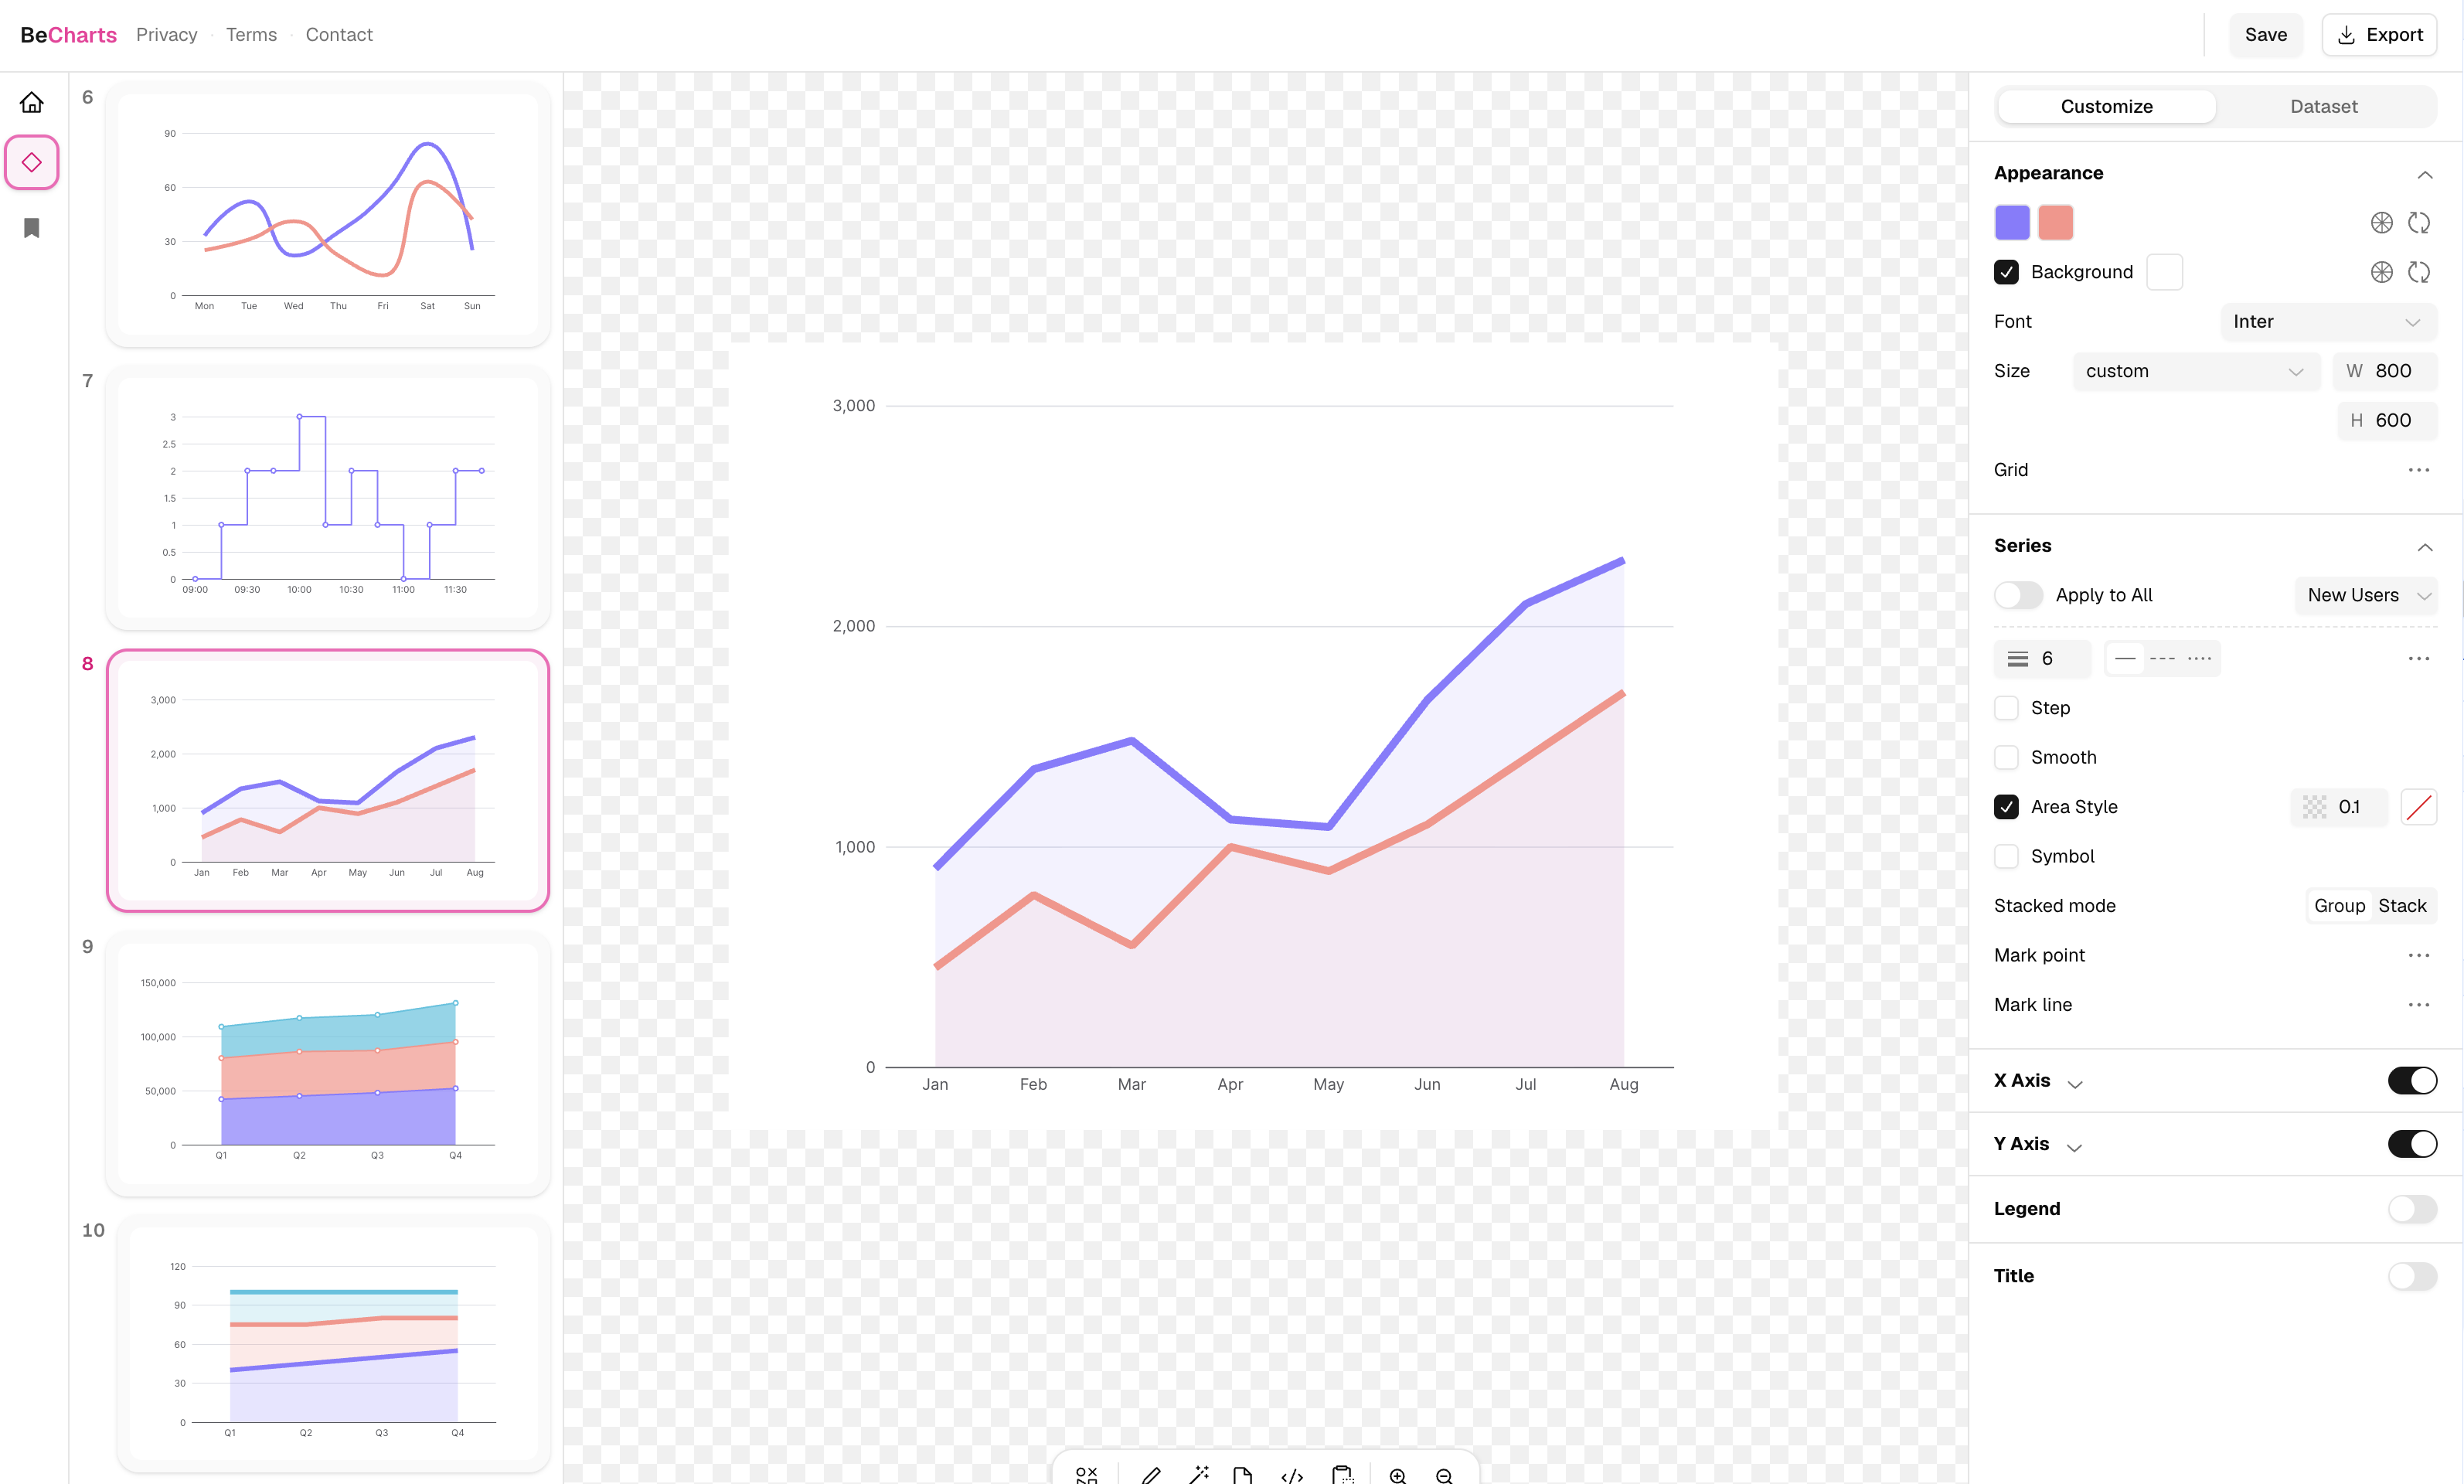
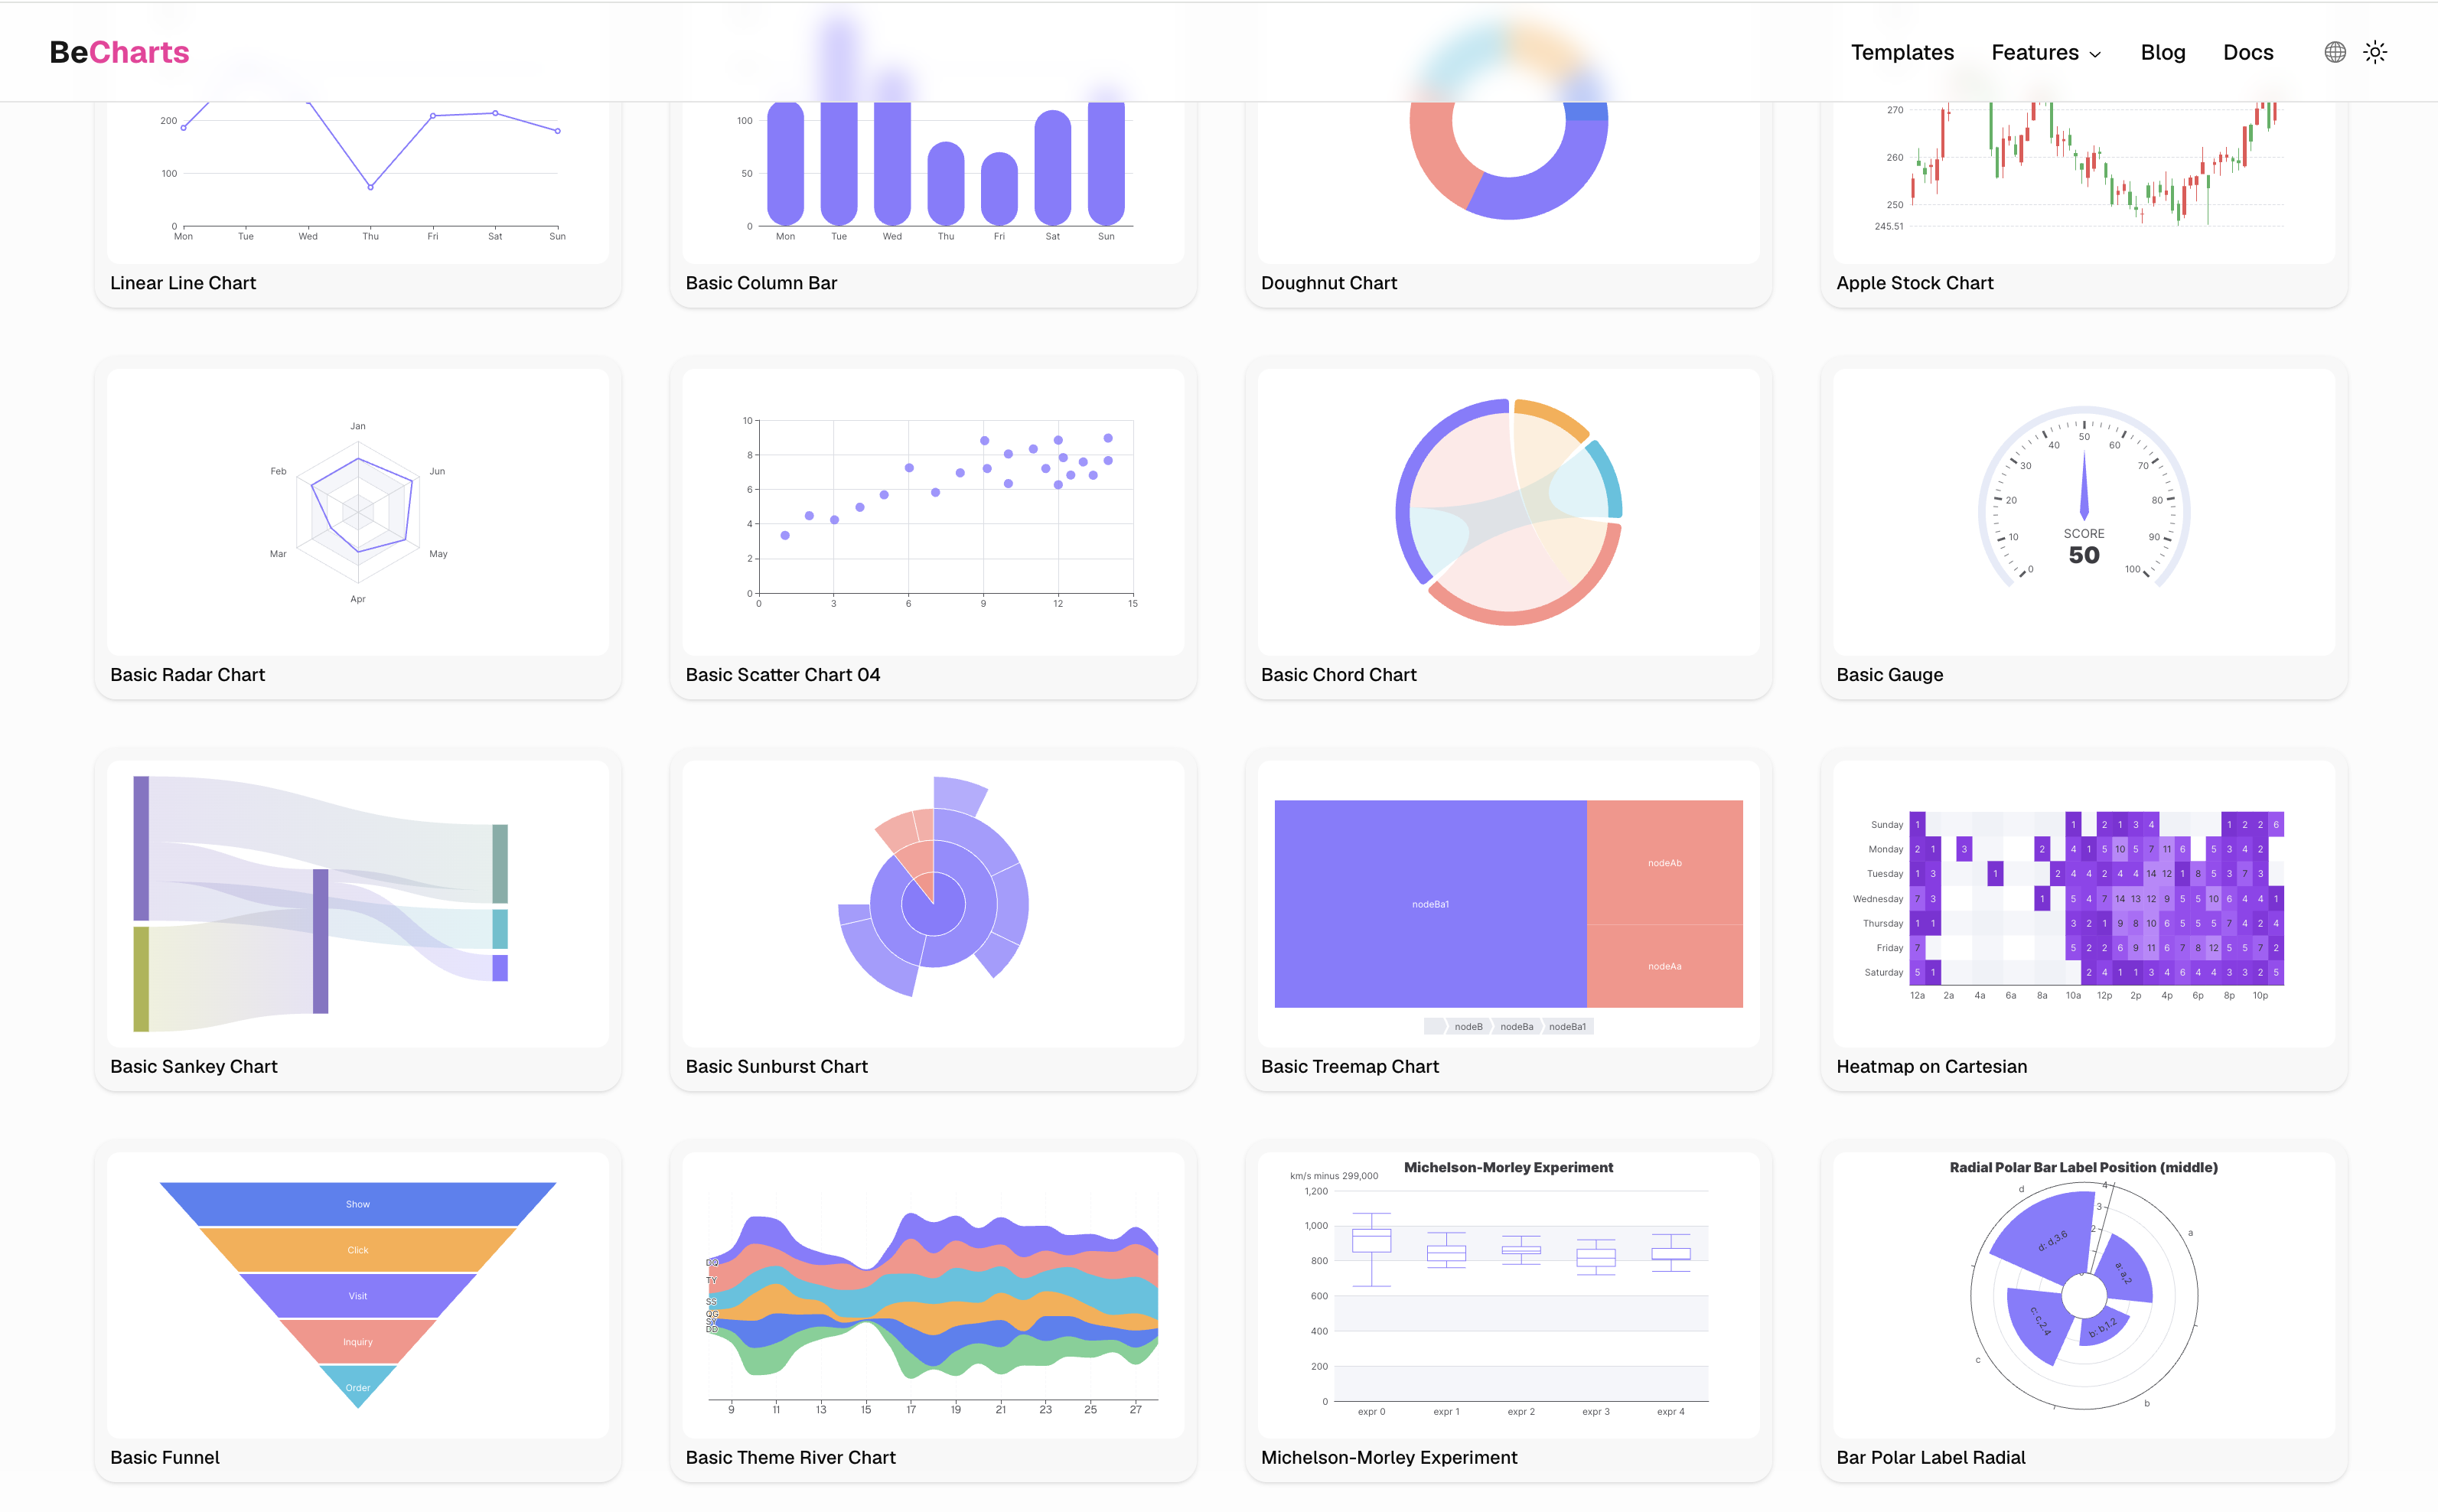
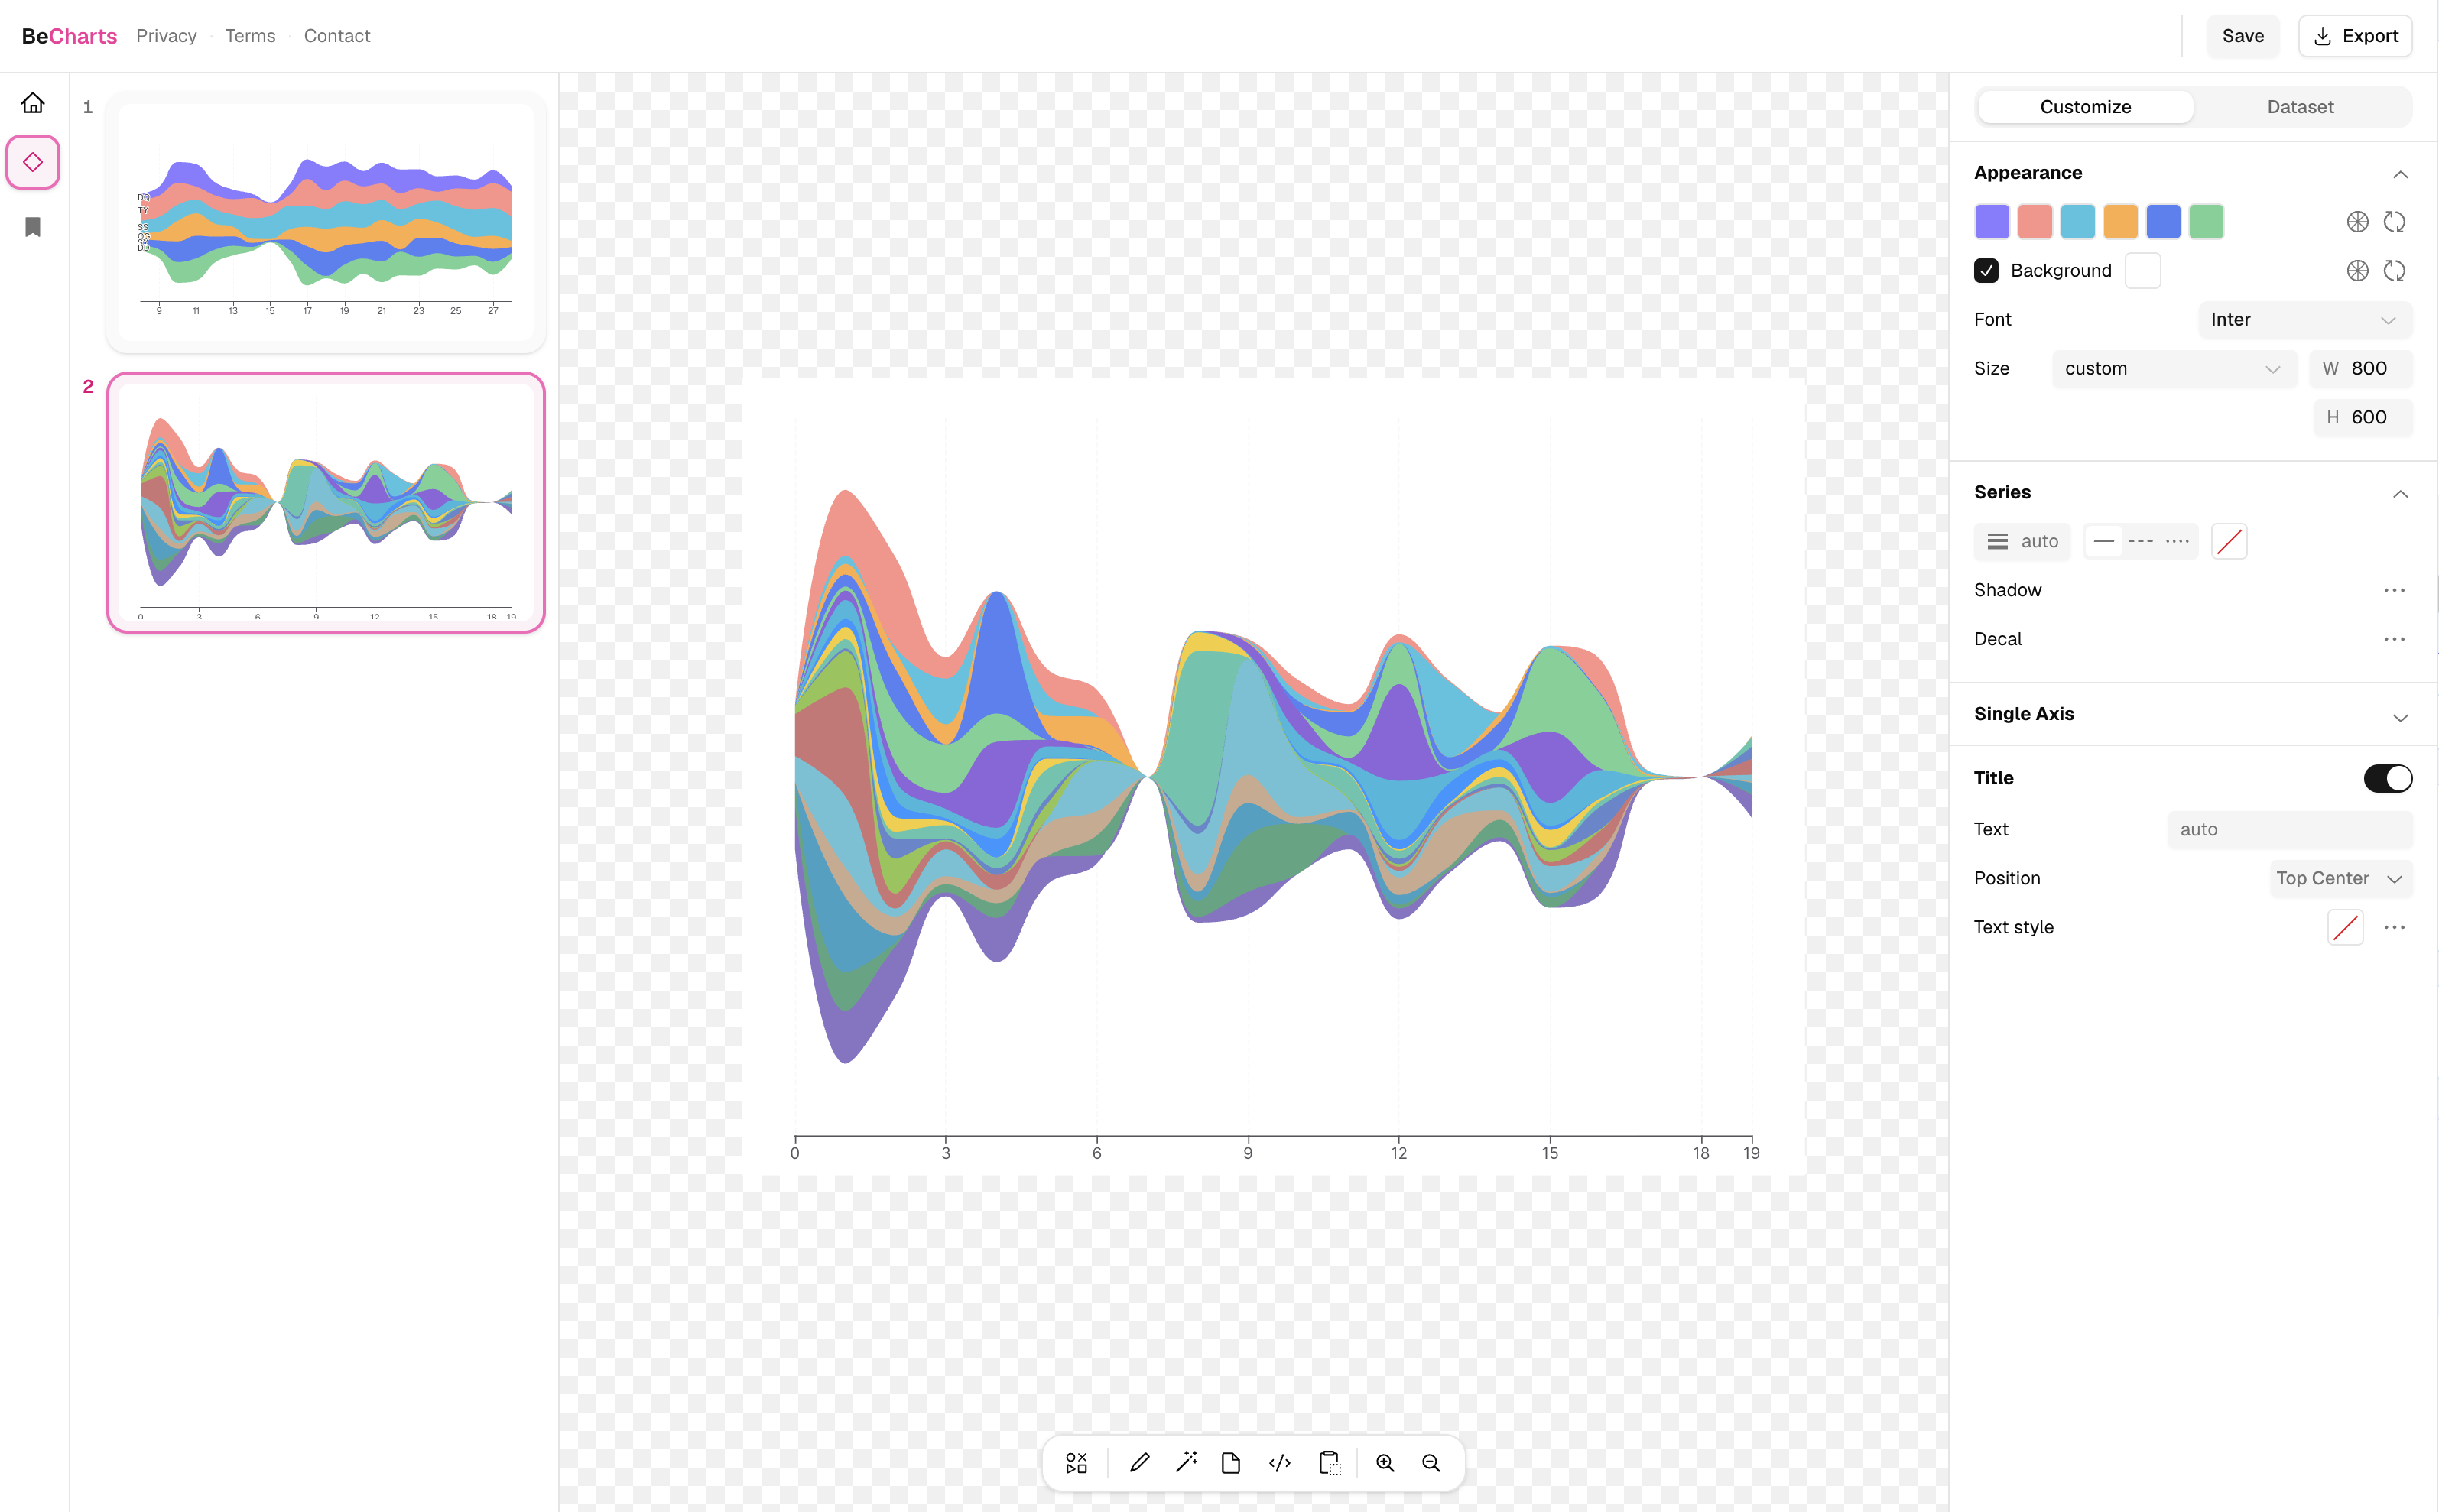
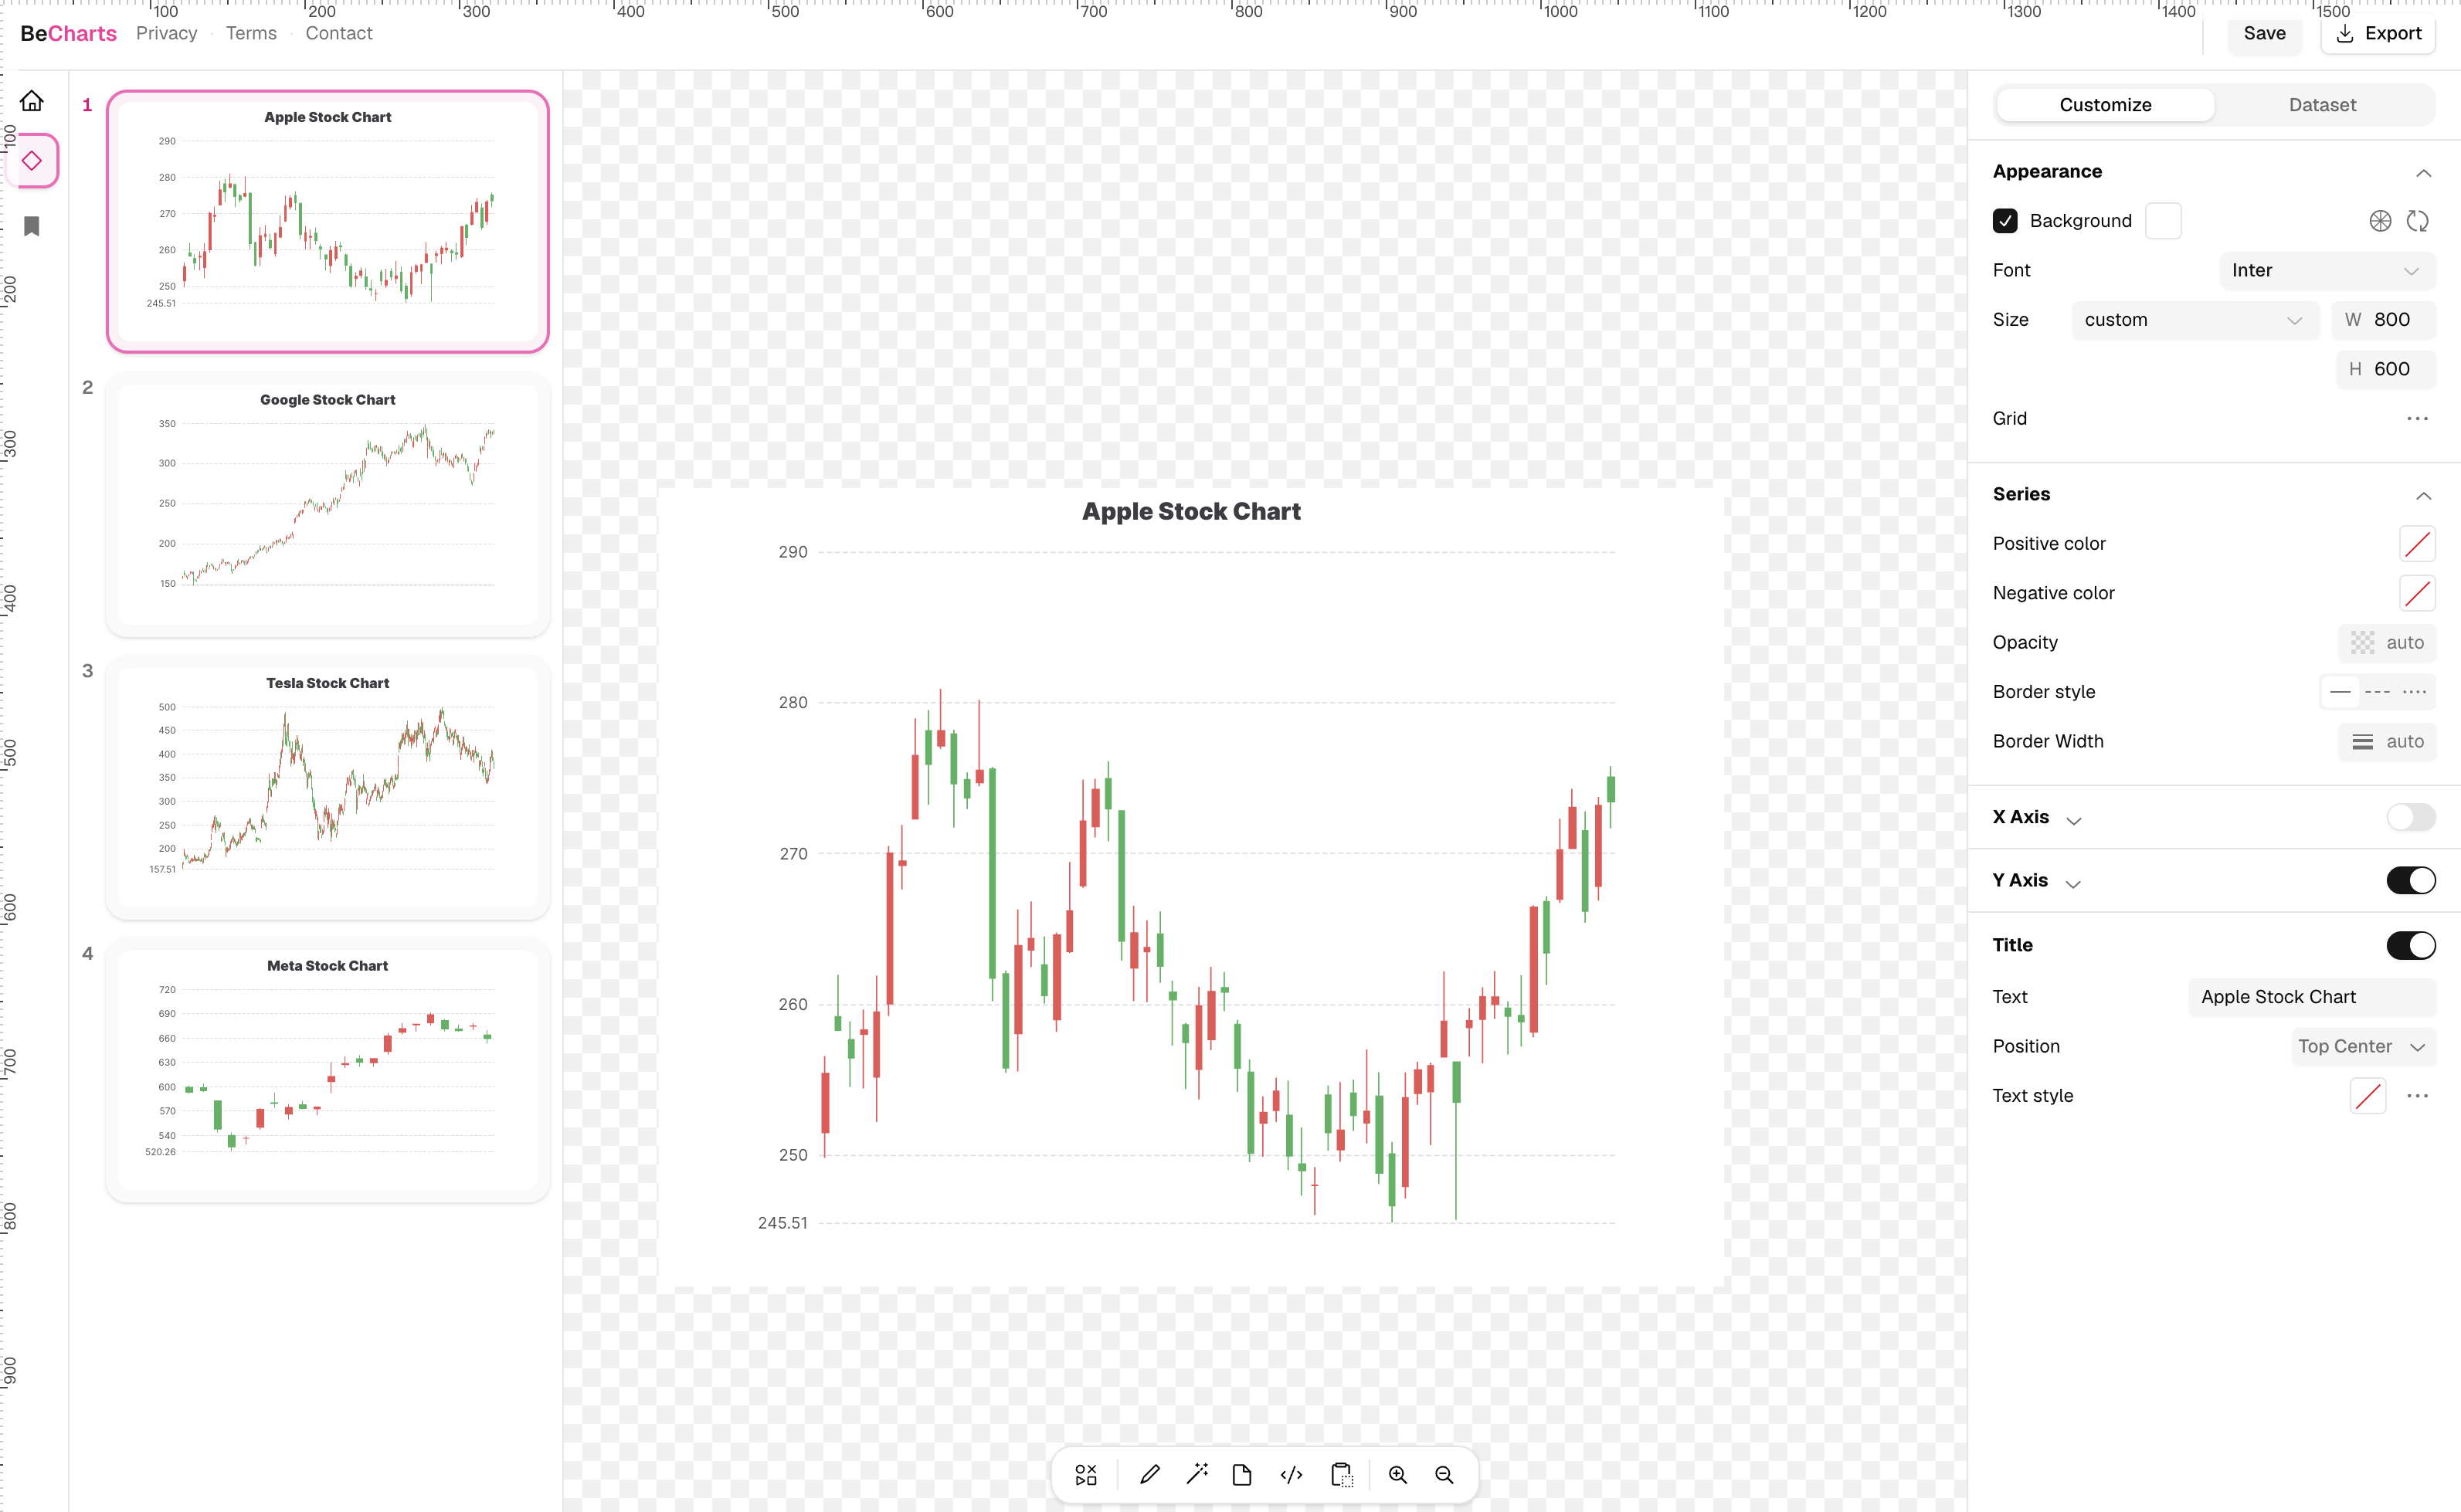
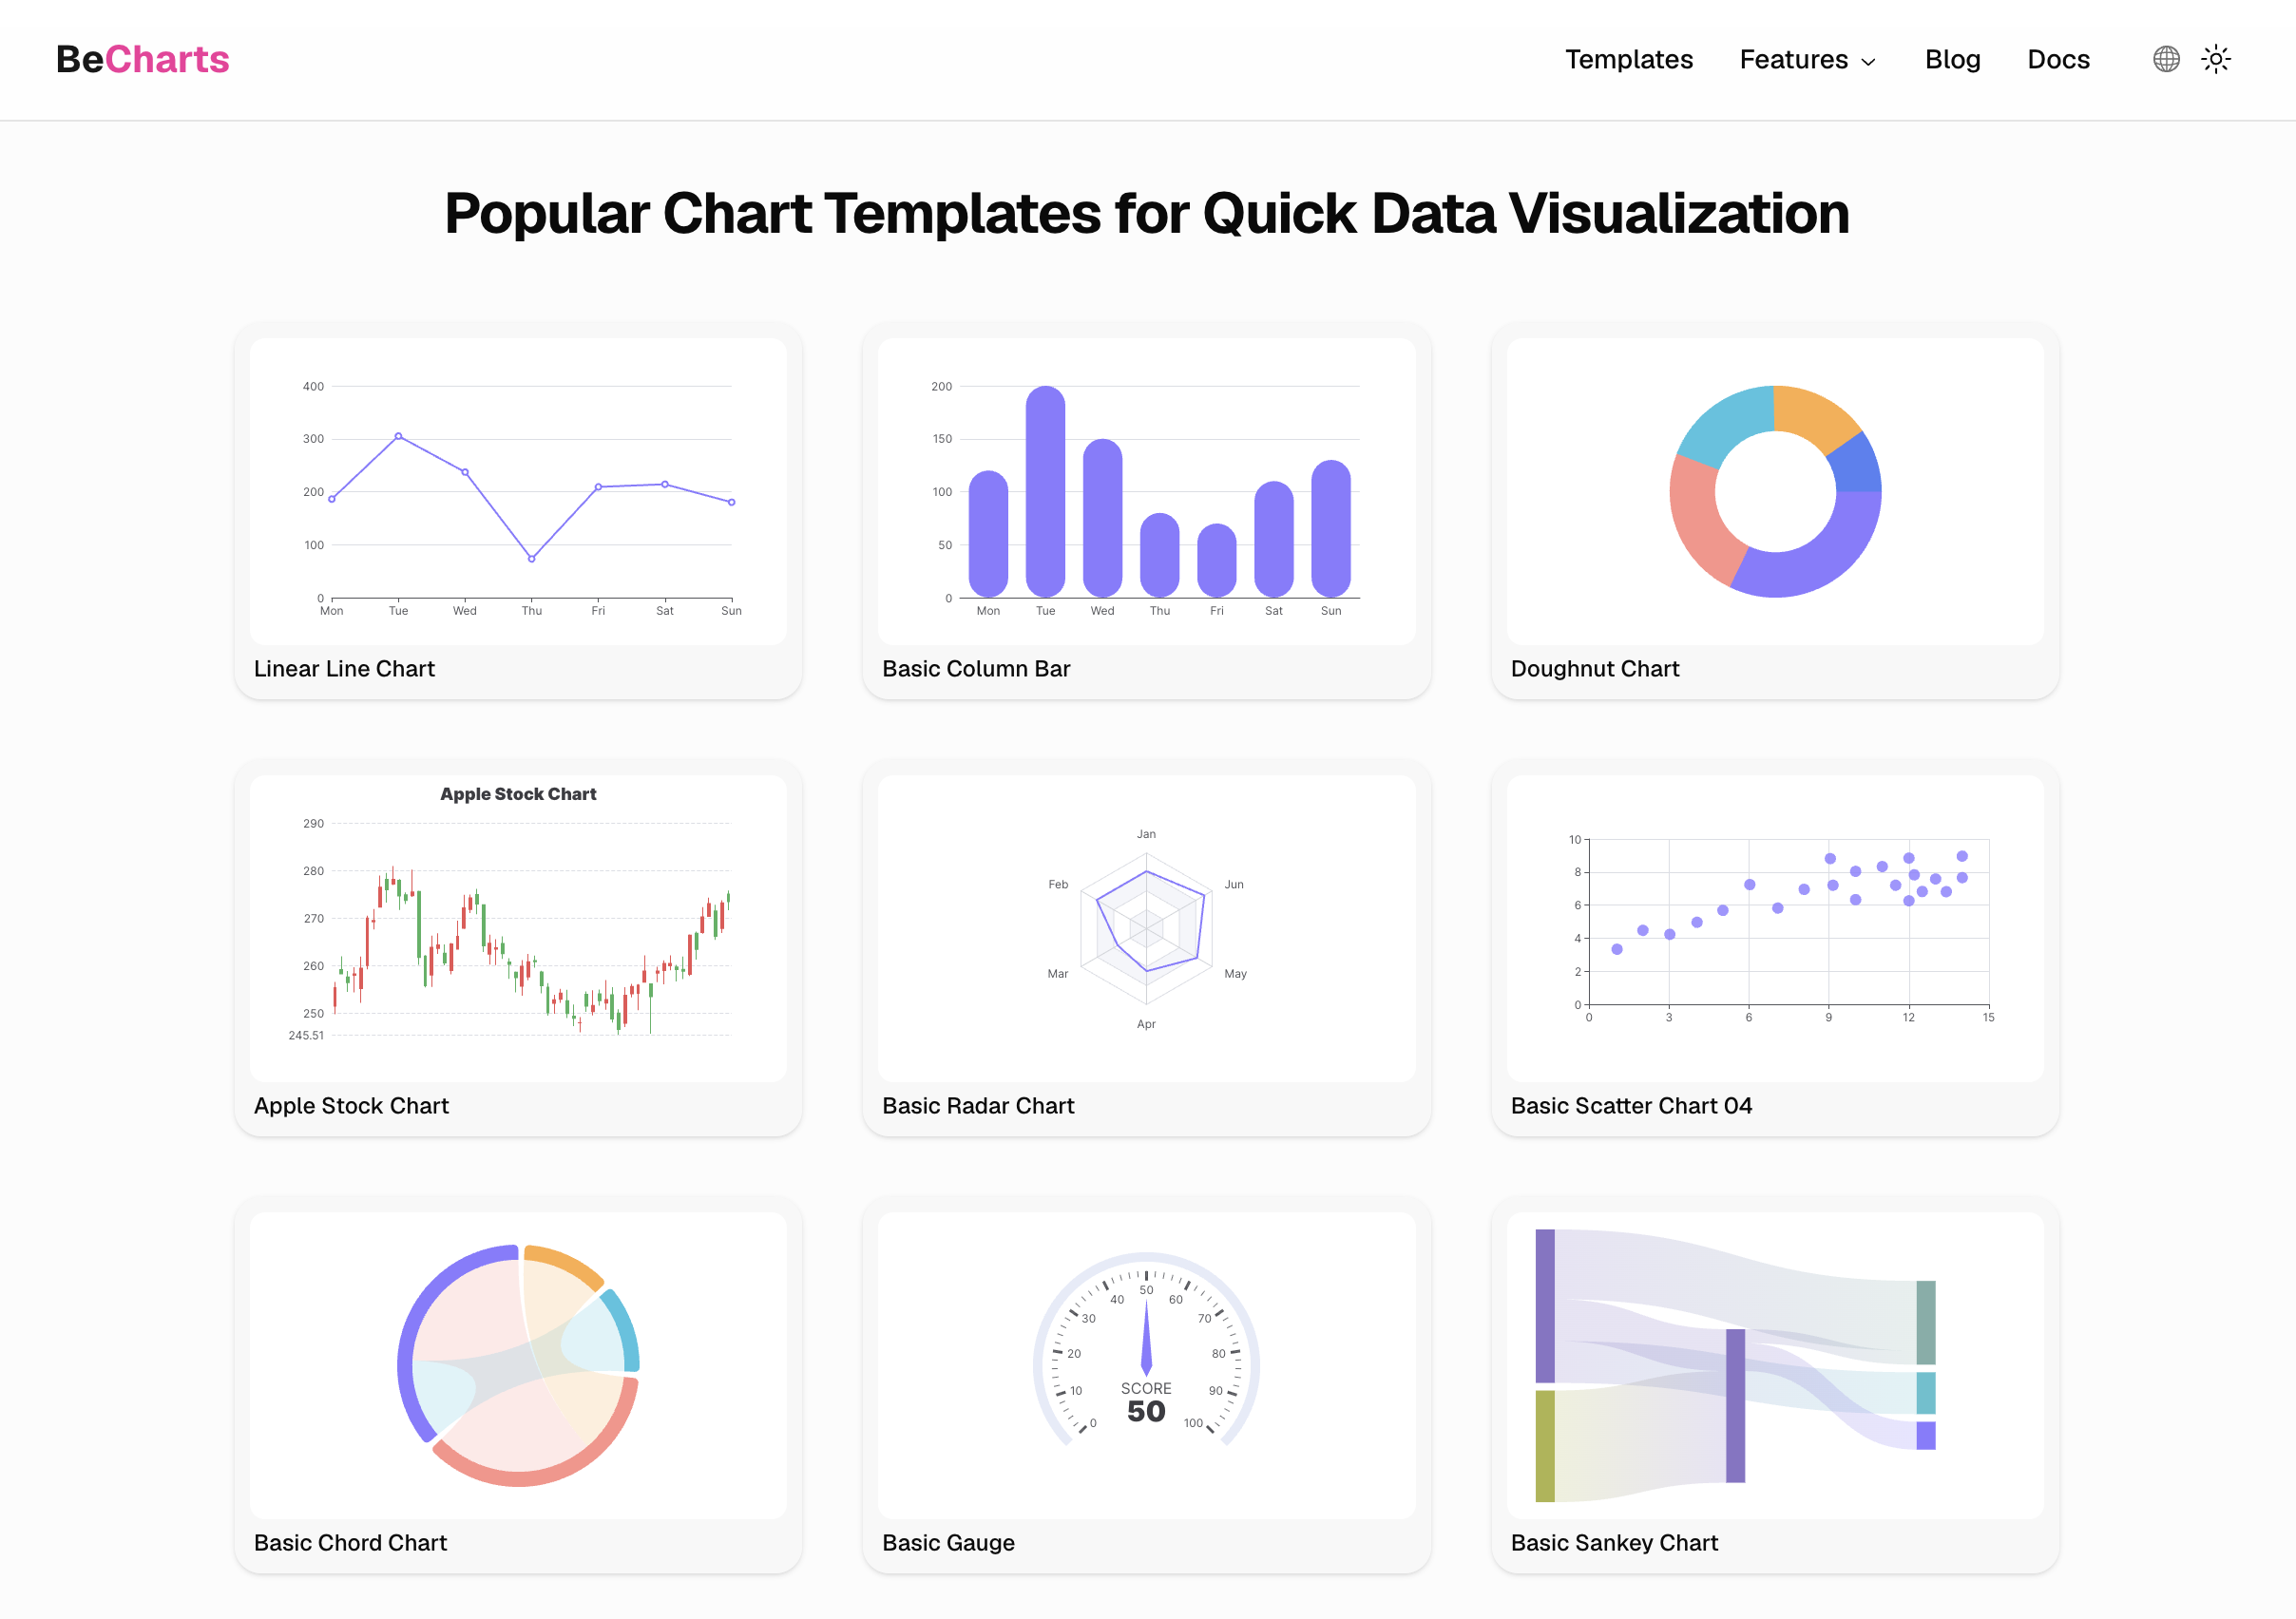
BeCharts is a browser-based chart editor for reports and dashboards. Pick from 100+ templates across 20+ chart types, import CSV or paste from Excel or Google Sheets (or describe data to the AI assistant), customize colors and labels with live preview, then export PNG, SVG, or PDF. No install. No account required to create and download—charts you save stay in your browser until you share.

Comments


Useful positioning for quick report and dashboard work. The value is not just drawing a chart, but reducing the handoff between raw data, a readable figure, and something a stakeholder can reuse. I would be curious whether BeCharts supports reusable templates, export formats, and data updates without rebuilding the chart.

Paste-from-Sheets is the detail that decides whether people actually finish a chart, so it is good to see it first-class. One suggestion: offer a permanent embed or image export at the free level, because reports and dashboards are rarely consumed inside the editor itself and a chart that cannot leave the tool does not finish the job.

I like that BeCharts works entirely in the browser without requiring an account to create charts. The CSV and spreadsheet import options make it practical for quick reporting. I'm curious whether it also supports collaborative editing or sharing live charts with a team instead of exporting static files.




No account needed to create and download is the right call for a tool like this — most chart builders lose people at the signup wall. Two things I'd look for as someone who exports charts into client reports: can I save a custom colour palette/brand preset so every chart matches without re-styling, and does the SVG export keep text as real text (editable in Figma/Illustrator) rather than outlines? Also, how does the "paste from Google Sheets" handle merged header rows or dates in different formats — that's where most CSV importers break. The 100+ templates across 20 chart types is a strong starting point for a side project.

Export fidelity is usually where online chart makers fall short, so I'd love to know: does BeCharts support vector export (SVG or PDF) so charts stay crisp when reports get printed or shared as PDFs? Also curious whether theming can be locked to a brand palette across an entire dashboard instead of styled per chart — keeping twenty charts visually consistent by hand is the most tedious part of client reporting. Real-time data refresh support would also be worth documenting, since most 'dashboard' tools turn out to be static image generators once you read the fine print.



Premium Products












































Sponsors
Buy

Makers
Makers
Comments
Useful positioning for quick report and dashboard work. The value is not just drawing a chart, but reducing the handoff between raw data, a readable figure, and something a stakeholder can reuse. I would be curious whether BeCharts supports reusable templates, export formats, and data updates without rebuilding the chart.
Paste-from-Sheets is the detail that decides whether people actually finish a chart, so it is good to see it first-class. One suggestion: offer a permanent embed or image export at the free level, because reports and dashboards are rarely consumed inside the editor itself and a chart that cannot leave the tool does not finish the job.
I like that BeCharts works entirely in the browser without requiring an account to create charts. The CSV and spreadsheet import options make it practical for quick reporting. I'm curious whether it also supports collaborative editing or sharing live charts with a team instead of exporting static files.
No account needed to create and download is the right call for a tool like this — most chart builders lose people at the signup wall. Two things I'd look for as someone who exports charts into client reports: can I save a custom colour palette/brand preset so every chart matches without re-styling, and does the SVG export keep text as real text (editable in Figma/Illustrator) rather than outlines? Also, how does the "paste from Google Sheets" handle merged header rows or dates in different formats — that's where most CSV importers break. The 100+ templates across 20 chart types is a strong starting point for a side project.
Export fidelity is usually where online chart makers fall short, so I'd love to know: does BeCharts support vector export (SVG or PDF) so charts stay crisp when reports get printed or shared as PDFs? Also curious whether theming can be locked to a brand palette across an entire dashboard instead of styled per chart — keeping twenty charts visually consistent by hand is the most tedious part of client reporting. Real-time data refresh support would also be worth documenting, since most 'dashboard' tools turn out to be static image generators once you read the fine print.
Premium Products
New to Fazier?

Find your next favorite product or submit your own. Made by @FalakDigital.
Copyright ©2026. All Rights Reserved