
Apex Cost Calculator
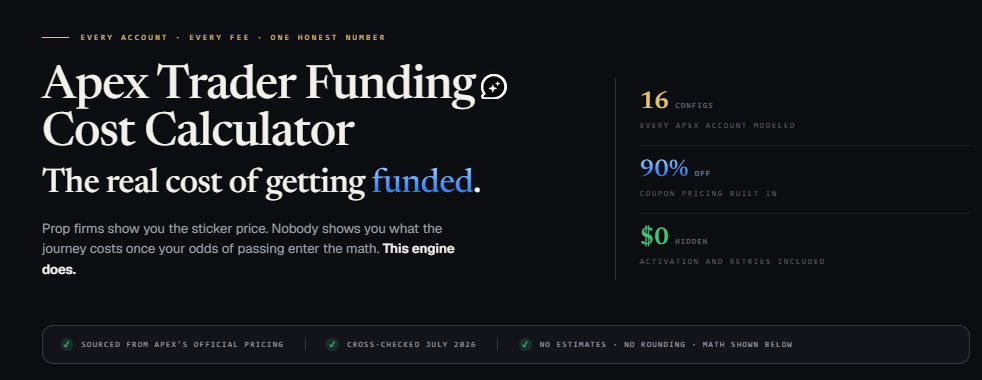
Compare the real cost of every Apex Trader Funding account
Features
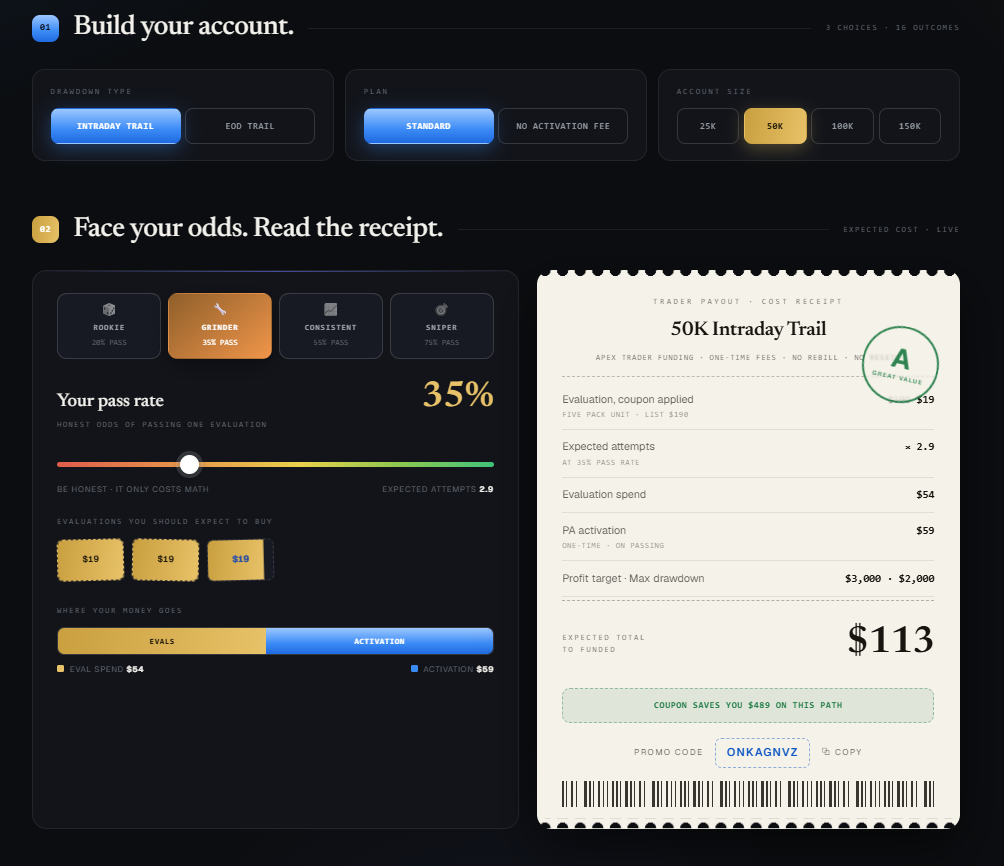
- Models 16 Apex account configurations by drawdown type, plan, and size
- Compares Intraday Trail vs. EOD Trail account types
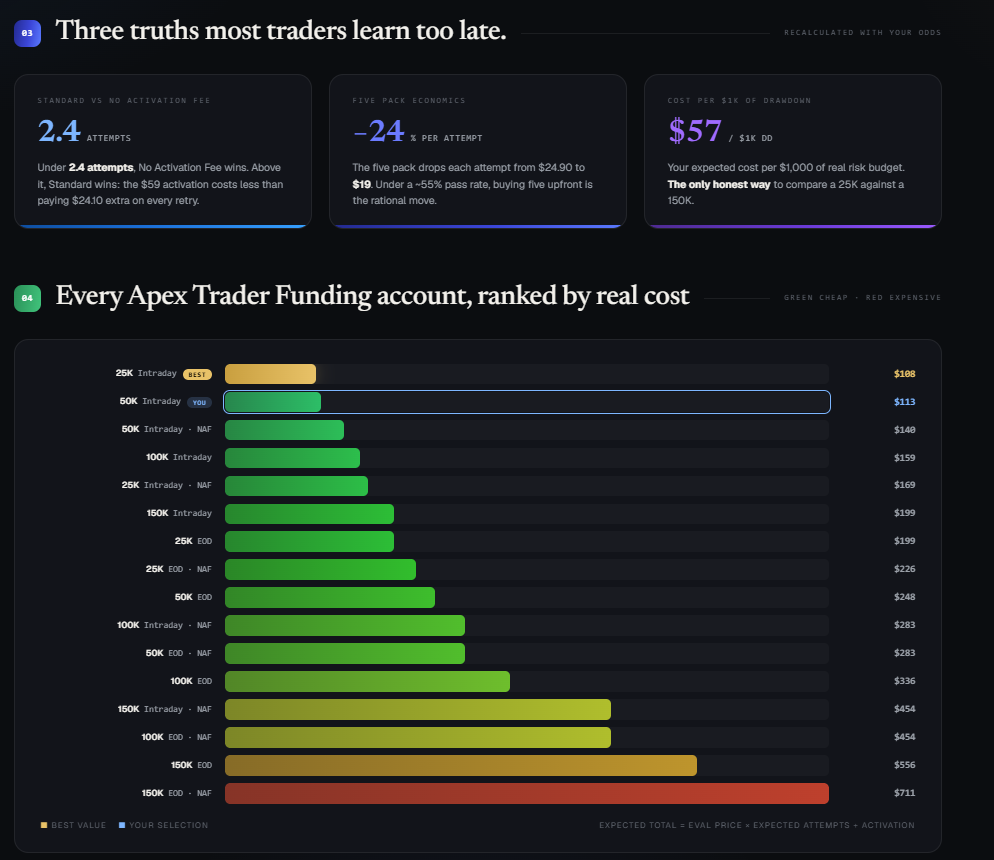
- Compares Standard vs. No Activation Fee plans
- Factors in pass odds, not just the listed evaluation price
- Shows expected total cost and cost per $1,000 of drawdown
- Ranks all account options by expected cost
Use Cases
- Deciding which Apex account size and plan to evaluate on
- Comparing Standard vs. No Activation Fee before signing up
- Understanding the real expected cost beyond the sticker price
- Checking cost per $1,000 of drawdown across account types

Comments


I built this after noticing most Apex Trader Funding comparisons only look at the upfront evaluation price. That misses a big part of the real cost: the chance of needing more than one attempt, plus the one-time activation fee once you pass. This calculator combines pass odds, evaluation fees, and activation costs into a single expected-cost number across all 16 Apex account configurations, so it's easier to compare Standard vs. No Activation Fee plans and different account sizes on equal footing. Happy to hear feedback, especially if you've been through the Apex evaluation process yourself and think the model is off anywhere.

Premium Products

















































Sponsors
Buy

Makers
Makers
Comments
I built this after noticing most Apex Trader Funding comparisons only look at the upfront evaluation price. That misses a big part of the real cost: the chance of needing more than one attempt, plus the one-time activation fee once you pass. This calculator combines pass odds, evaluation fees, and activation costs into a single expected-cost number across all 16 Apex account configurations, so it's easier to compare Standard vs. No Activation Fee plans and different account sizes on equal footing. Happy to hear feedback, especially if you've been through the Apex evaluation process yourself and think the model is off anywhere.
Premium Products
New to Fazier?

Find your next favorite product or submit your own. Made by @FalakDigital.
Copyright ©2026. All Rights Reserved