
AddGraph
A tool that graph diagramming and data visualization.
AddGraph is a JavaScript, Simple to use, powerful editor for general graph diagramming or whiteboarding application.

Features
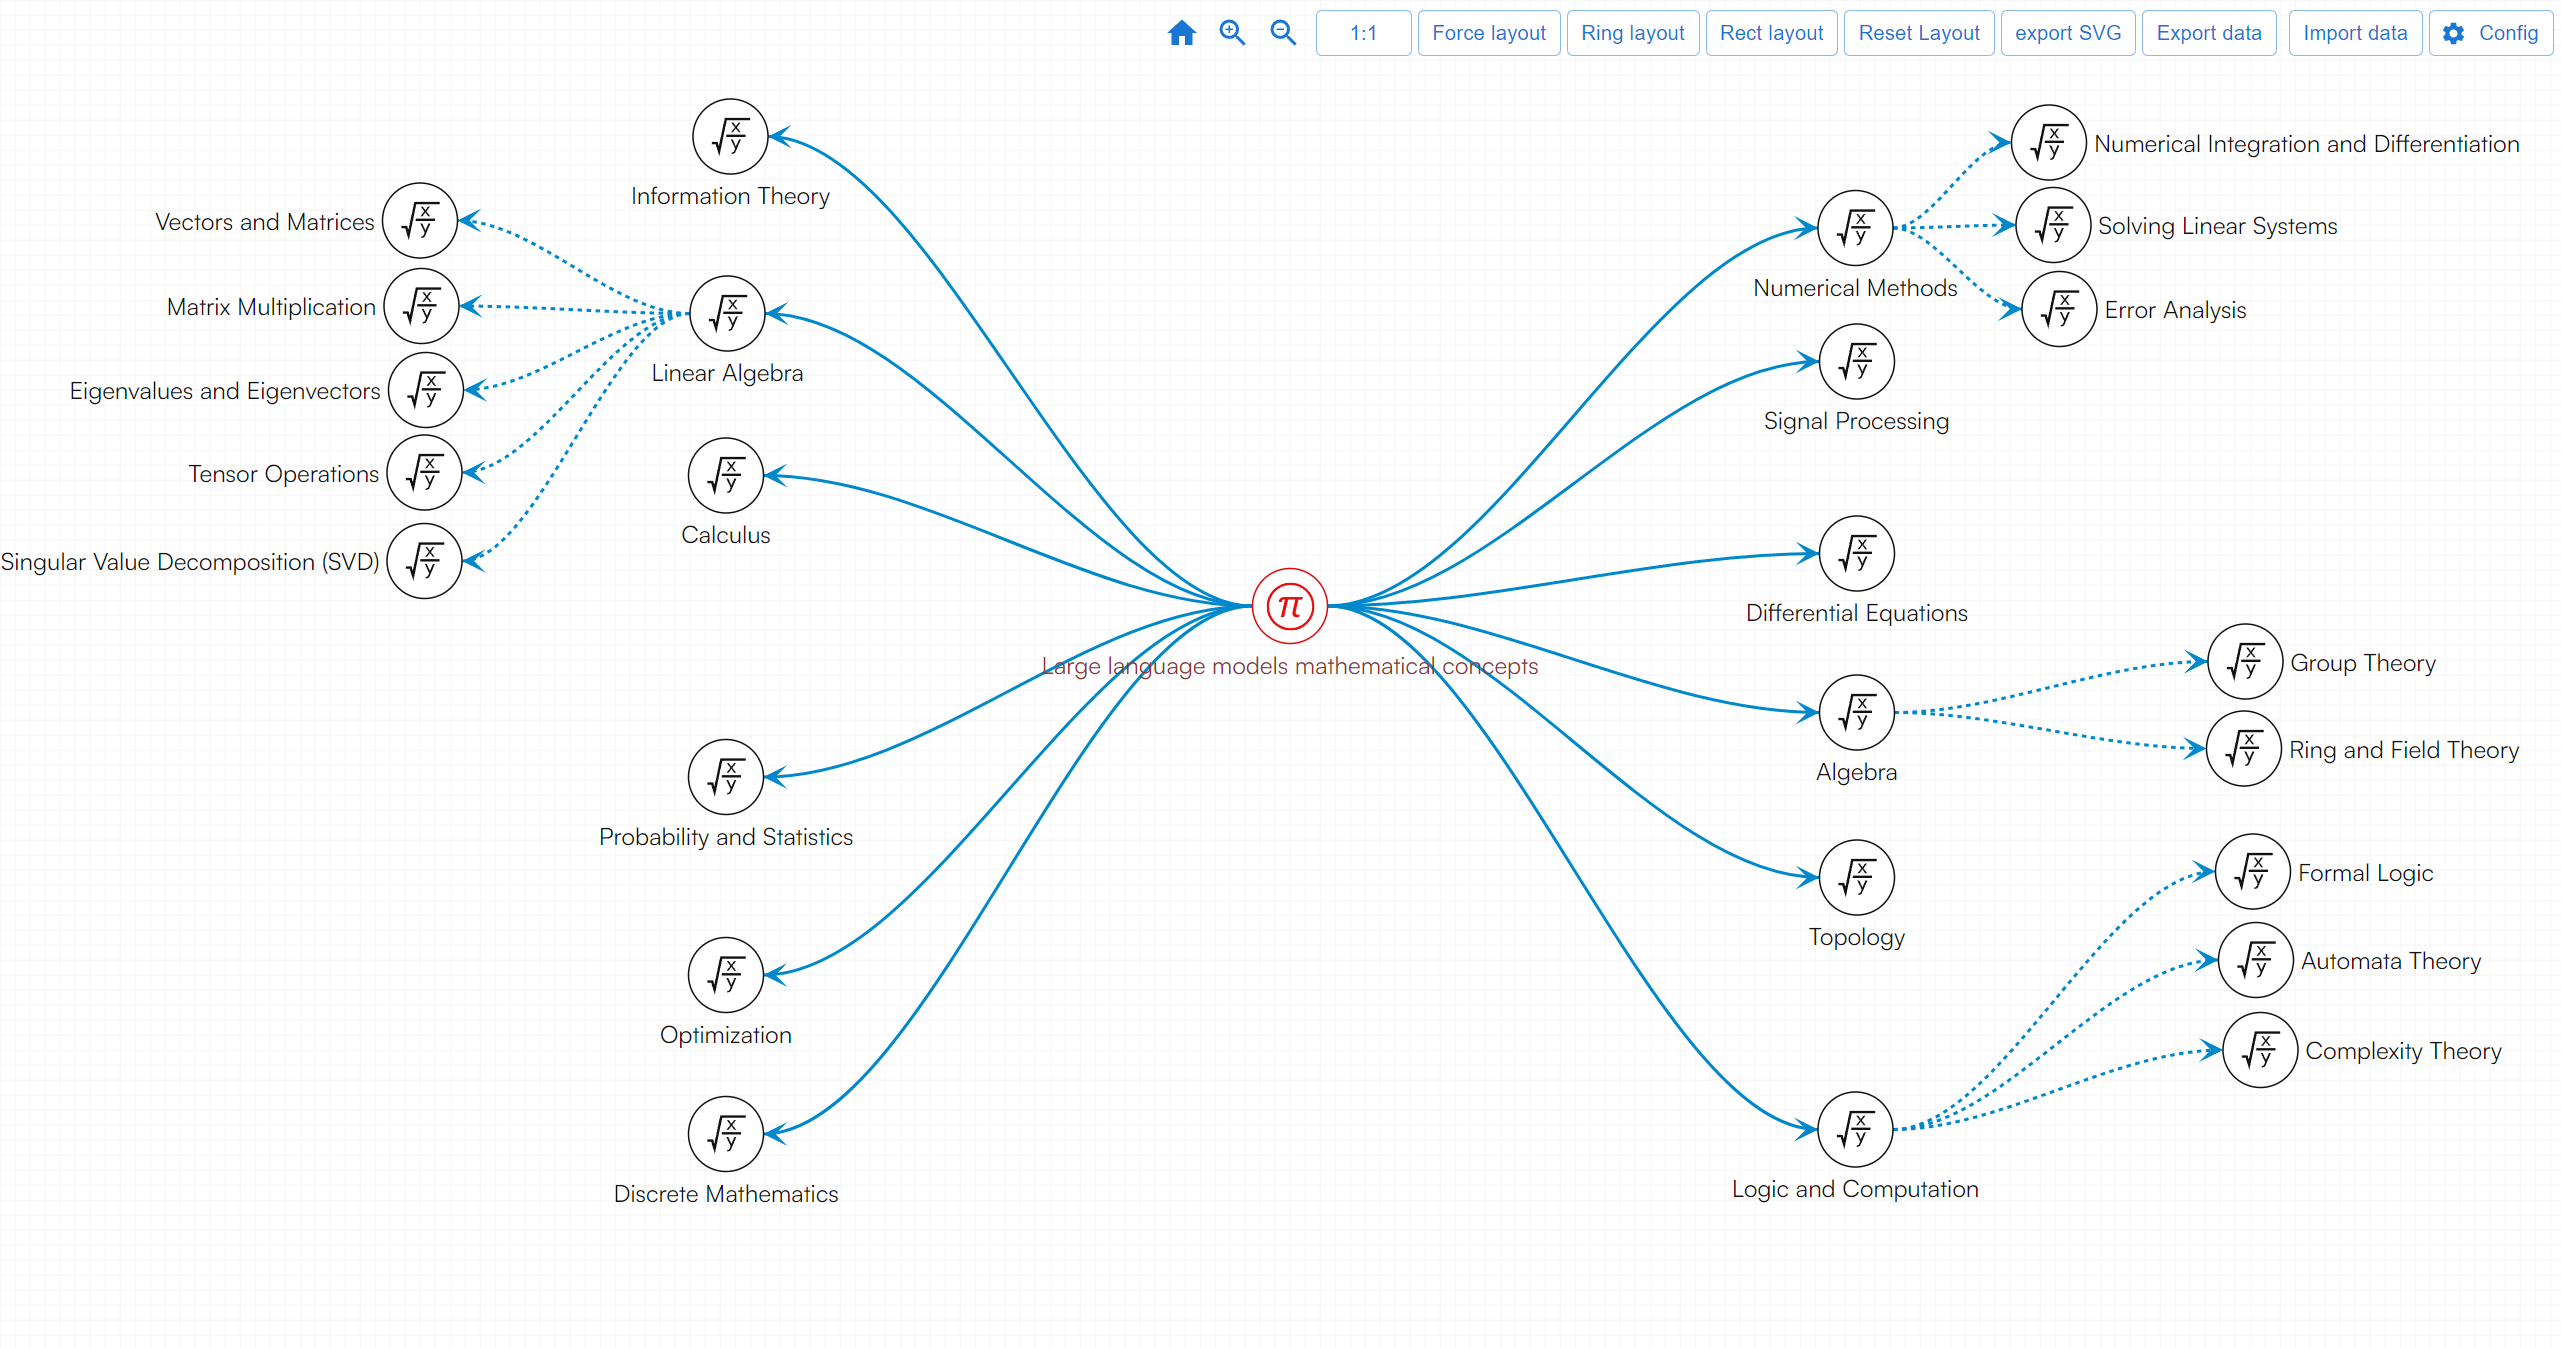
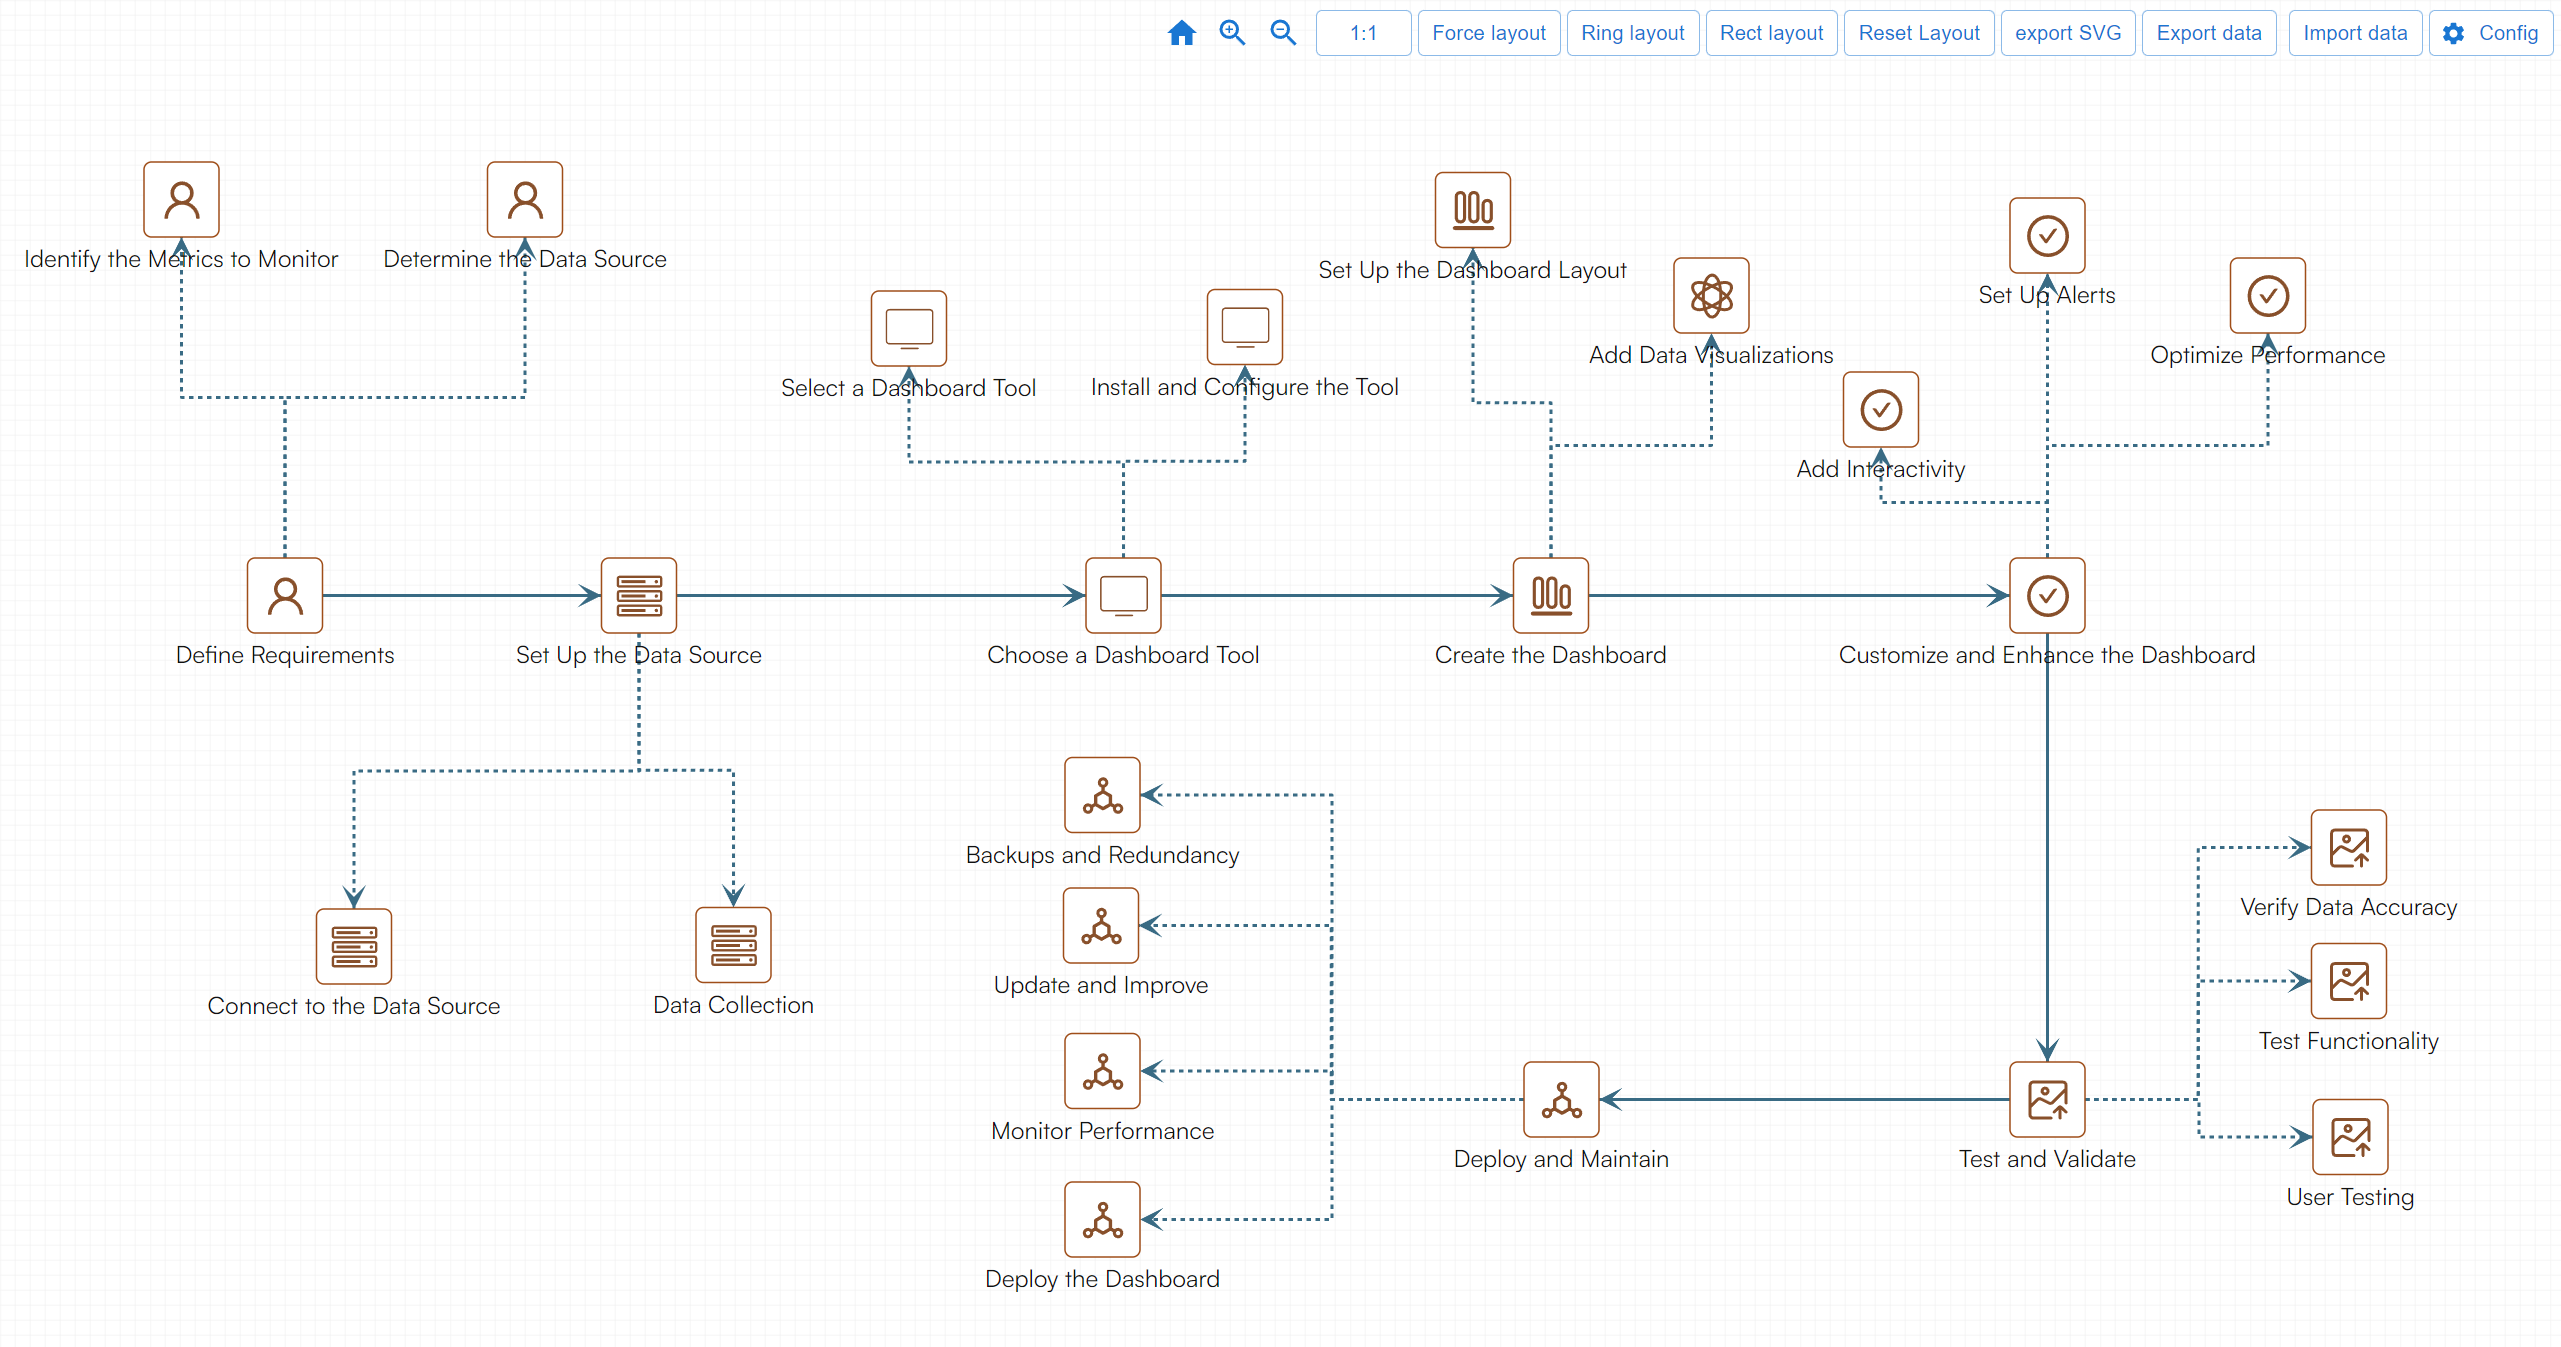
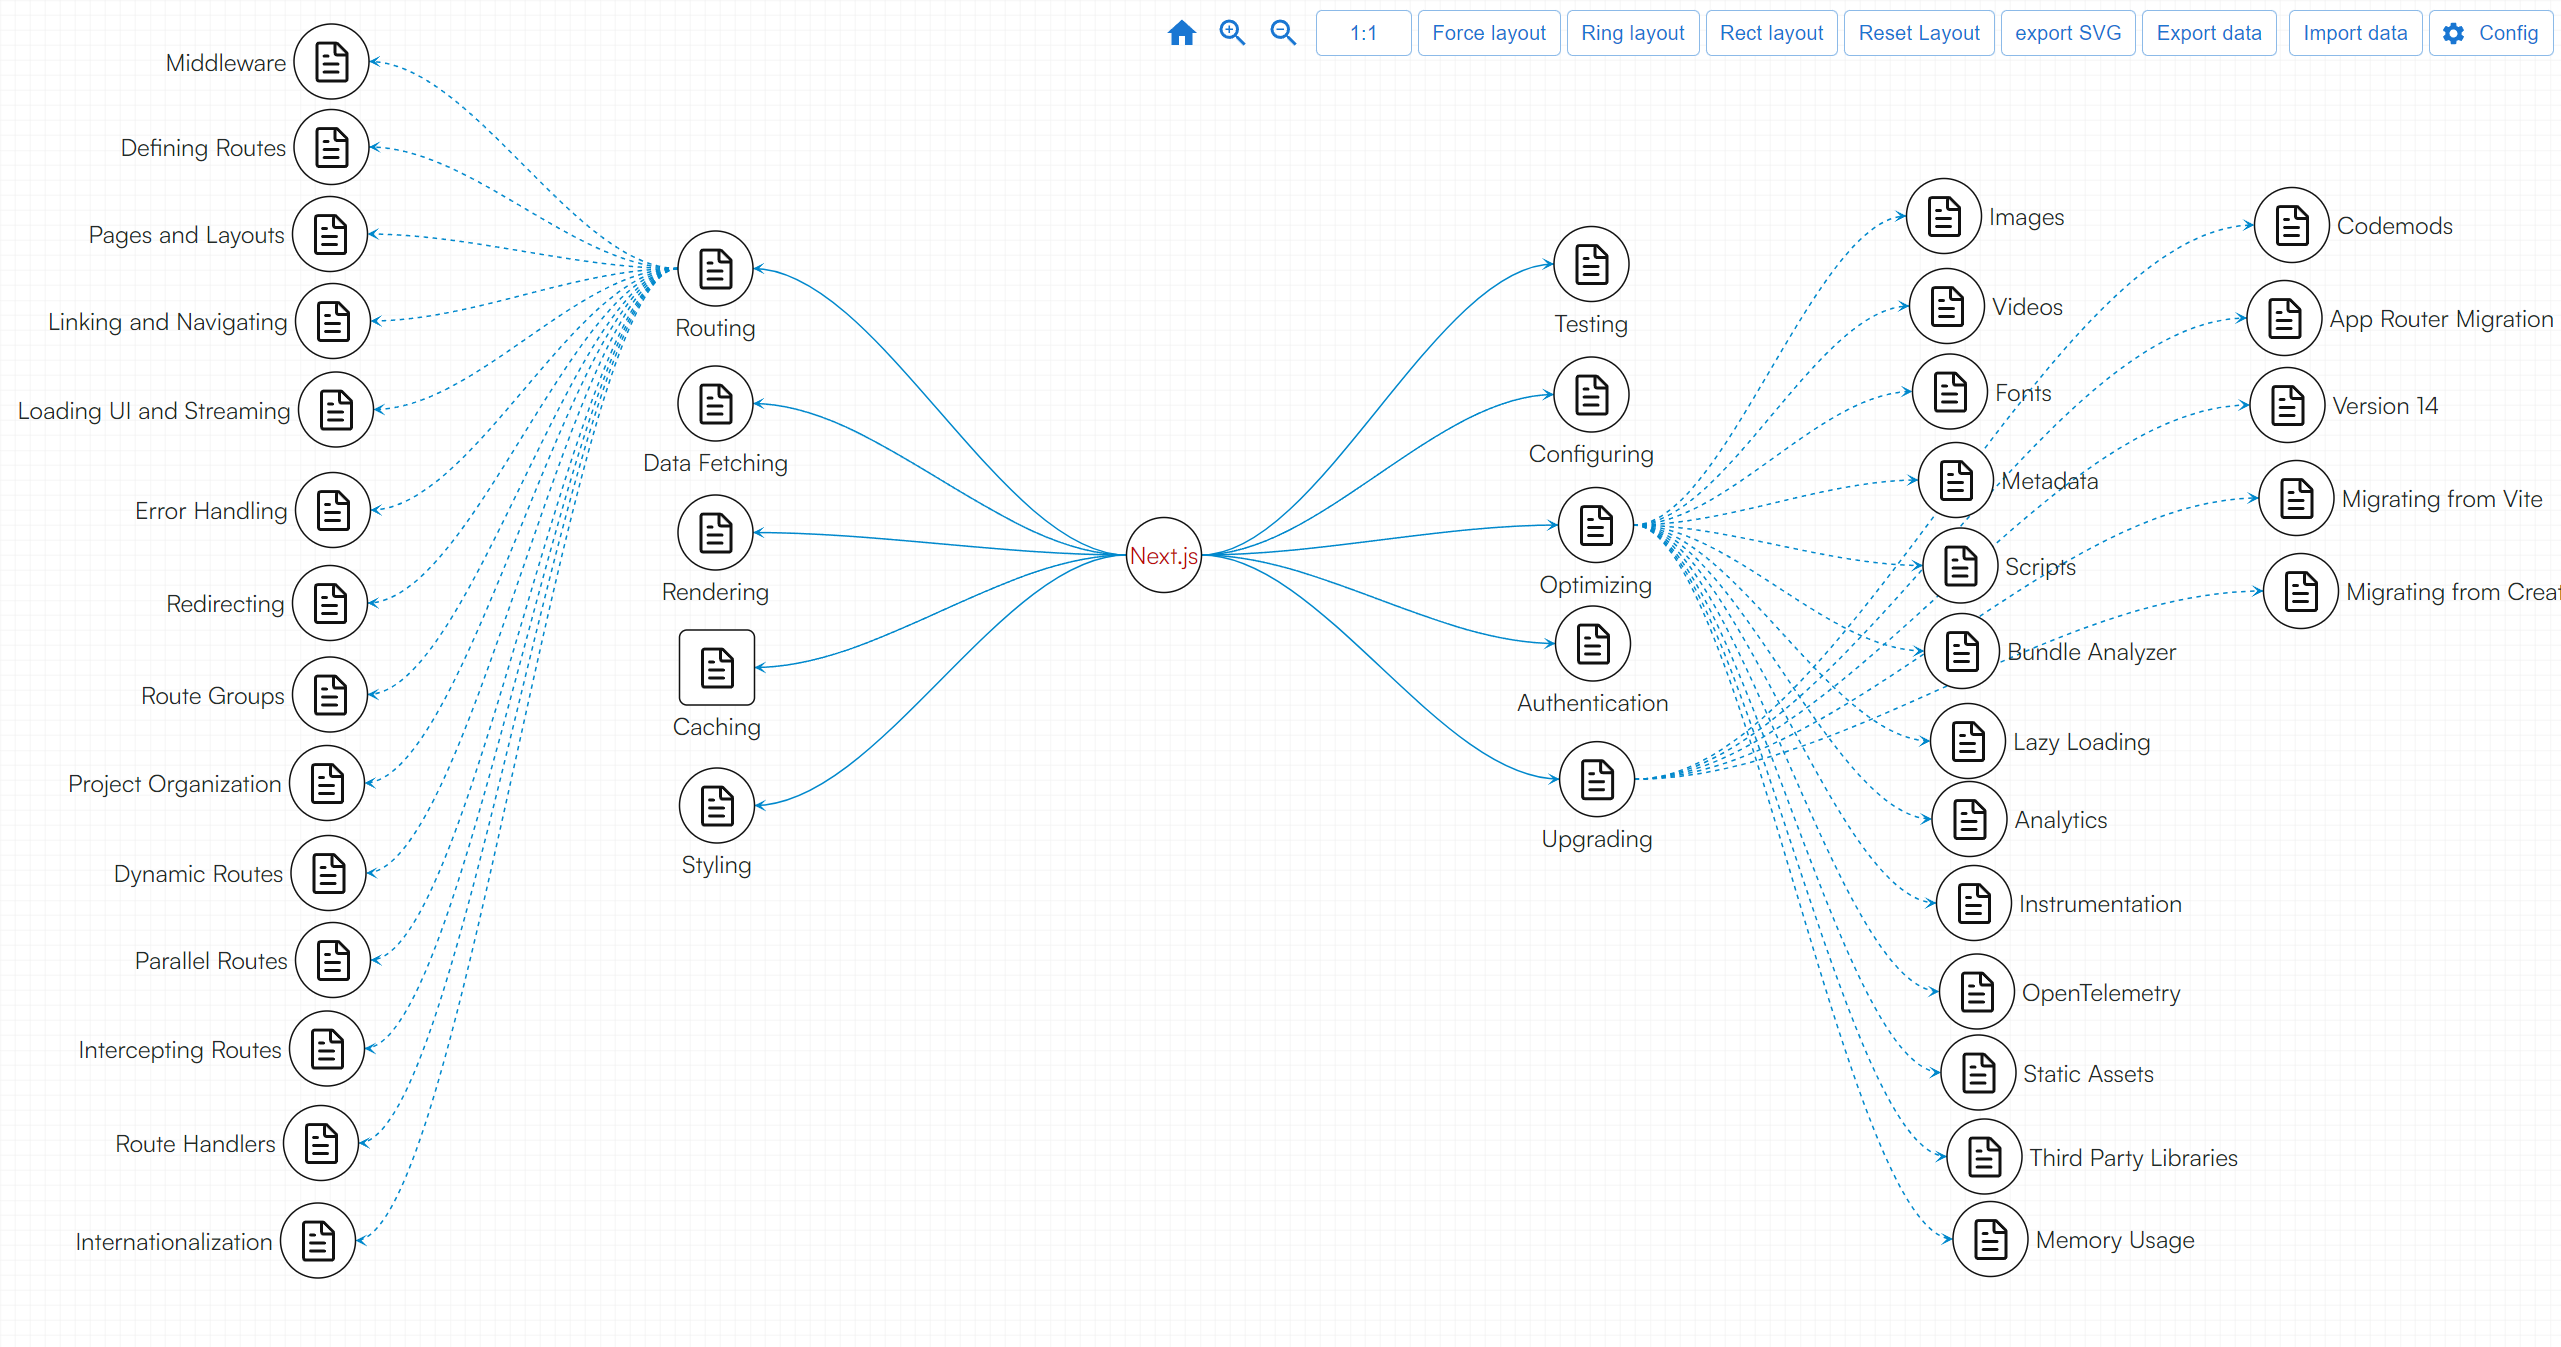
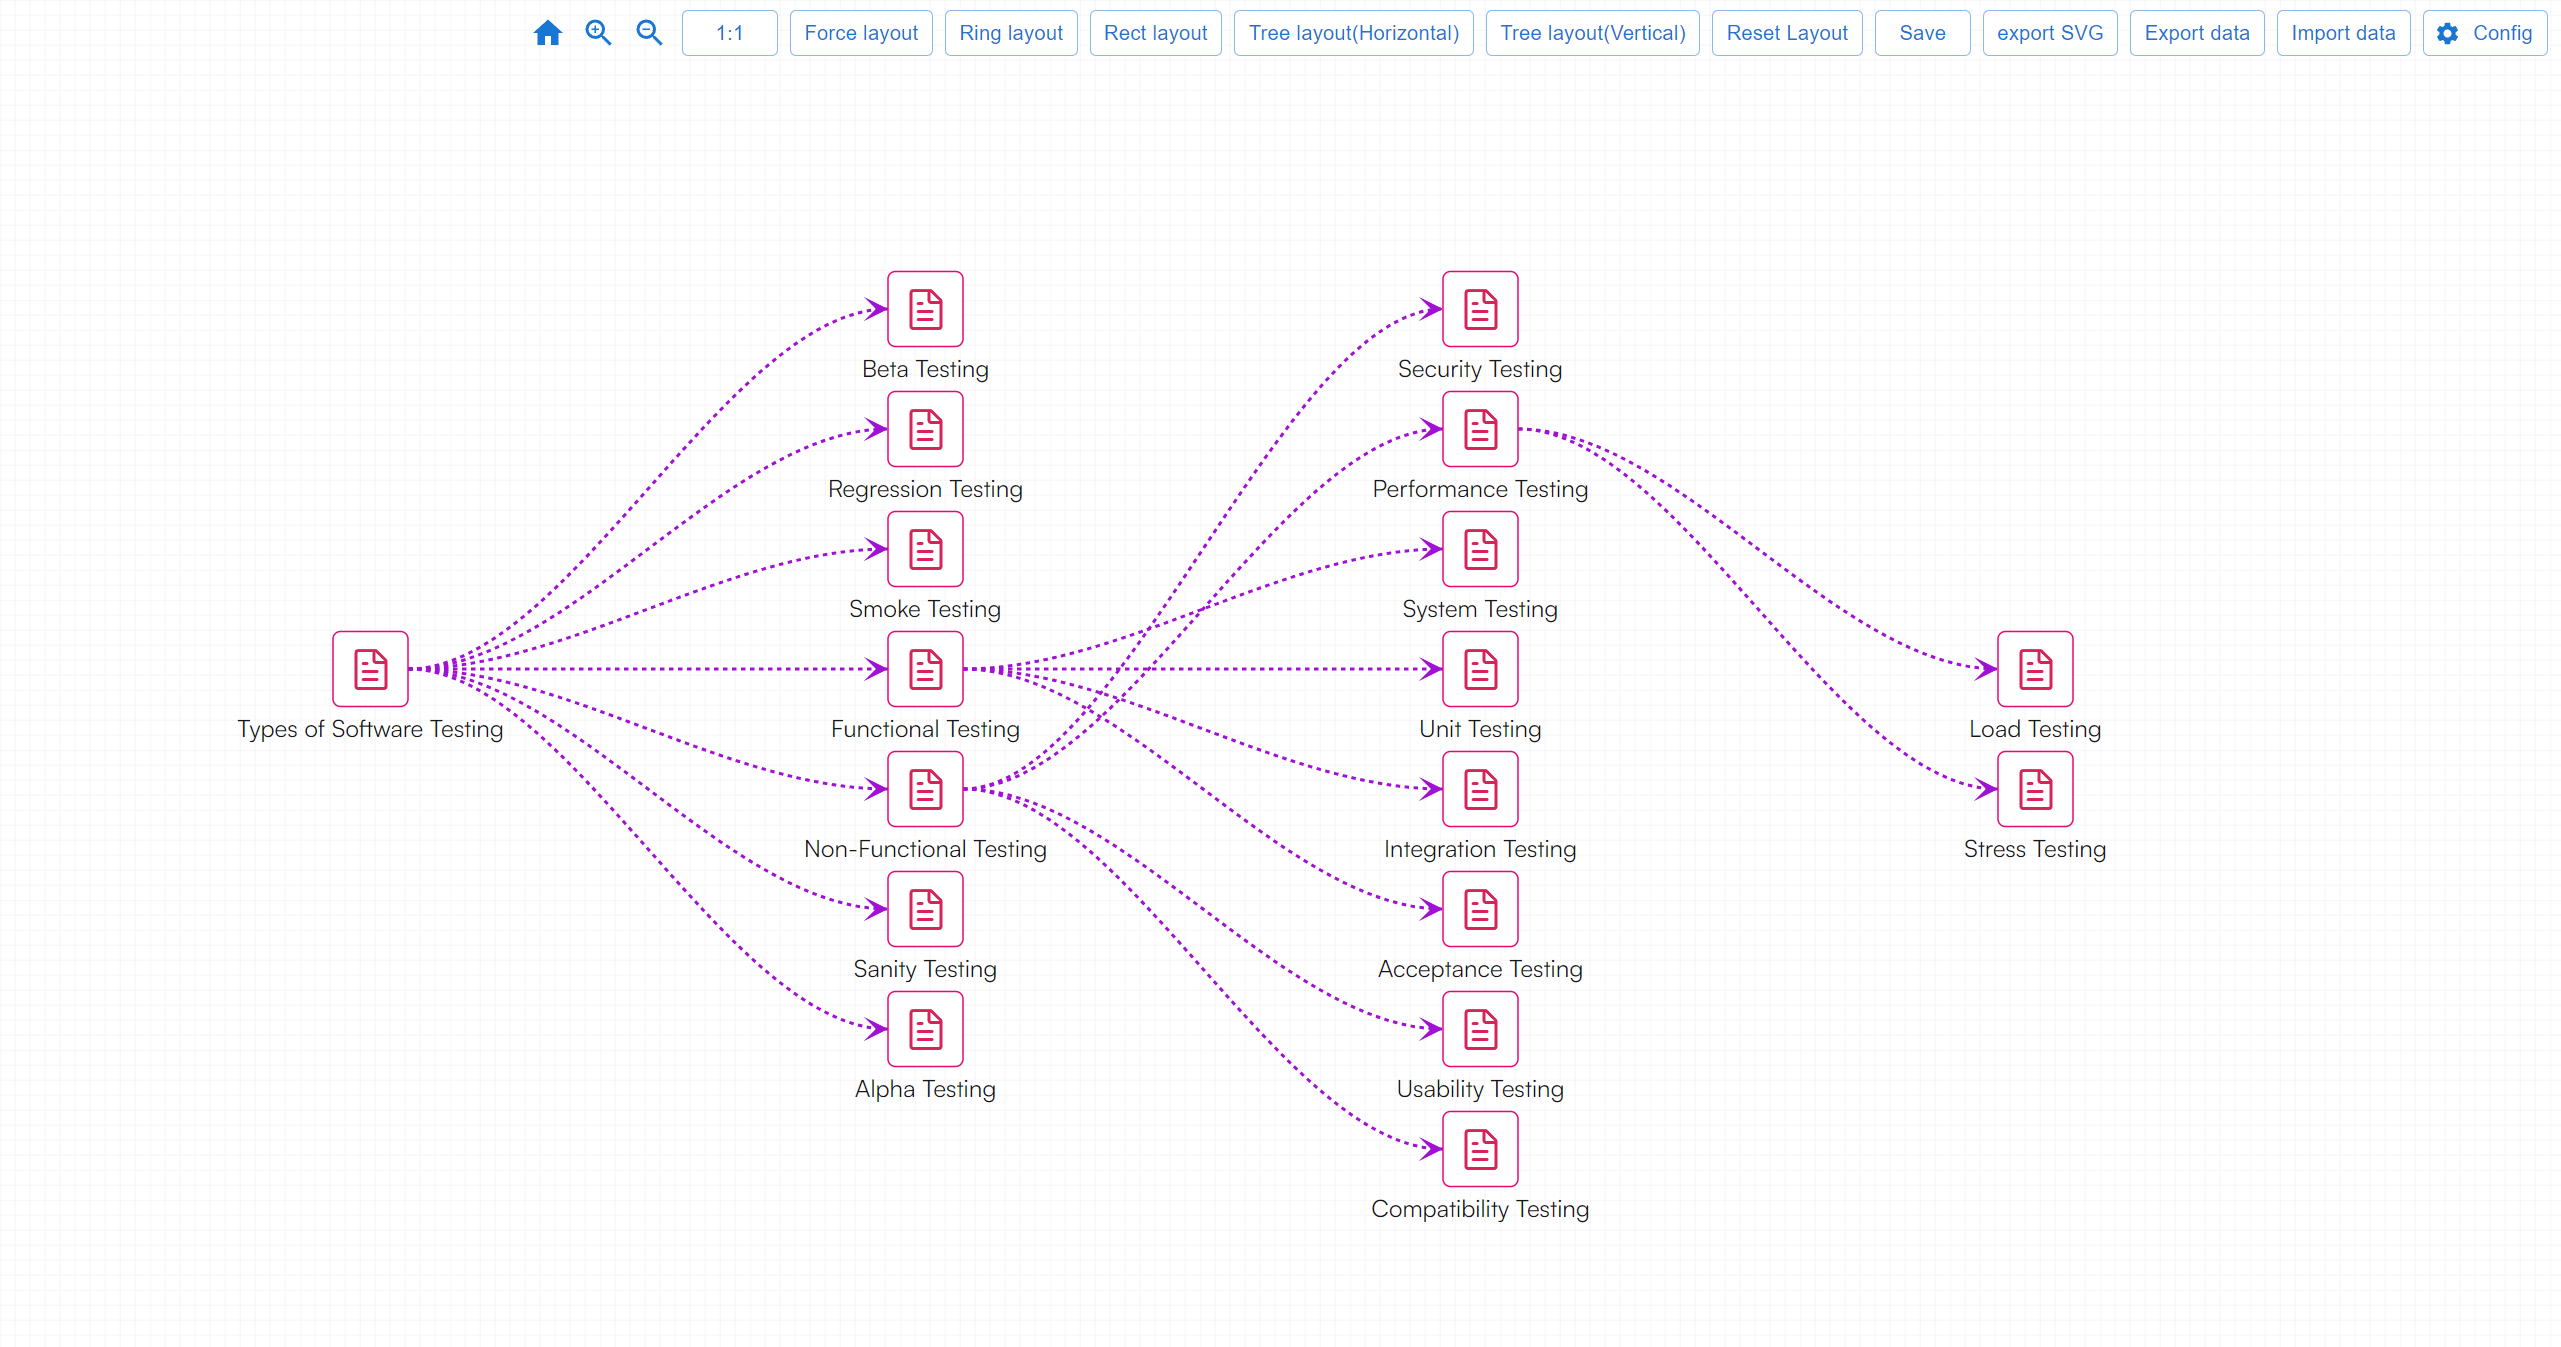
AddGraph is a very simple and powerful graph diagramming tool. Compared with other diagramming tools, AddGraph is faster in adding nodes and lines. Nodes can be resized, icons can be customized, icon colors, border colors, and title colors can be changed. Lines can also be set to straight lines, dashed lines, and broken lines. Of course, the color and line width can also be changed. You can also set titles for lines, and of course you can set arrows for lines.
AddGraph can also be used as a data visualization tool. Currently, it provides three different layout methods: Force layout, Circular layout, Horizontal Tree Layout, Vertical Tree Layout, and Rectangular layout.The layout transformation is an animation effect.

Comments

Premium Products


Find your next favorite product or submit your own. Made by @FalakDigital.
Copyright ©2025. All Rights Reserved