
Zenstat
Track ZenHub sprint metrics across workspaces
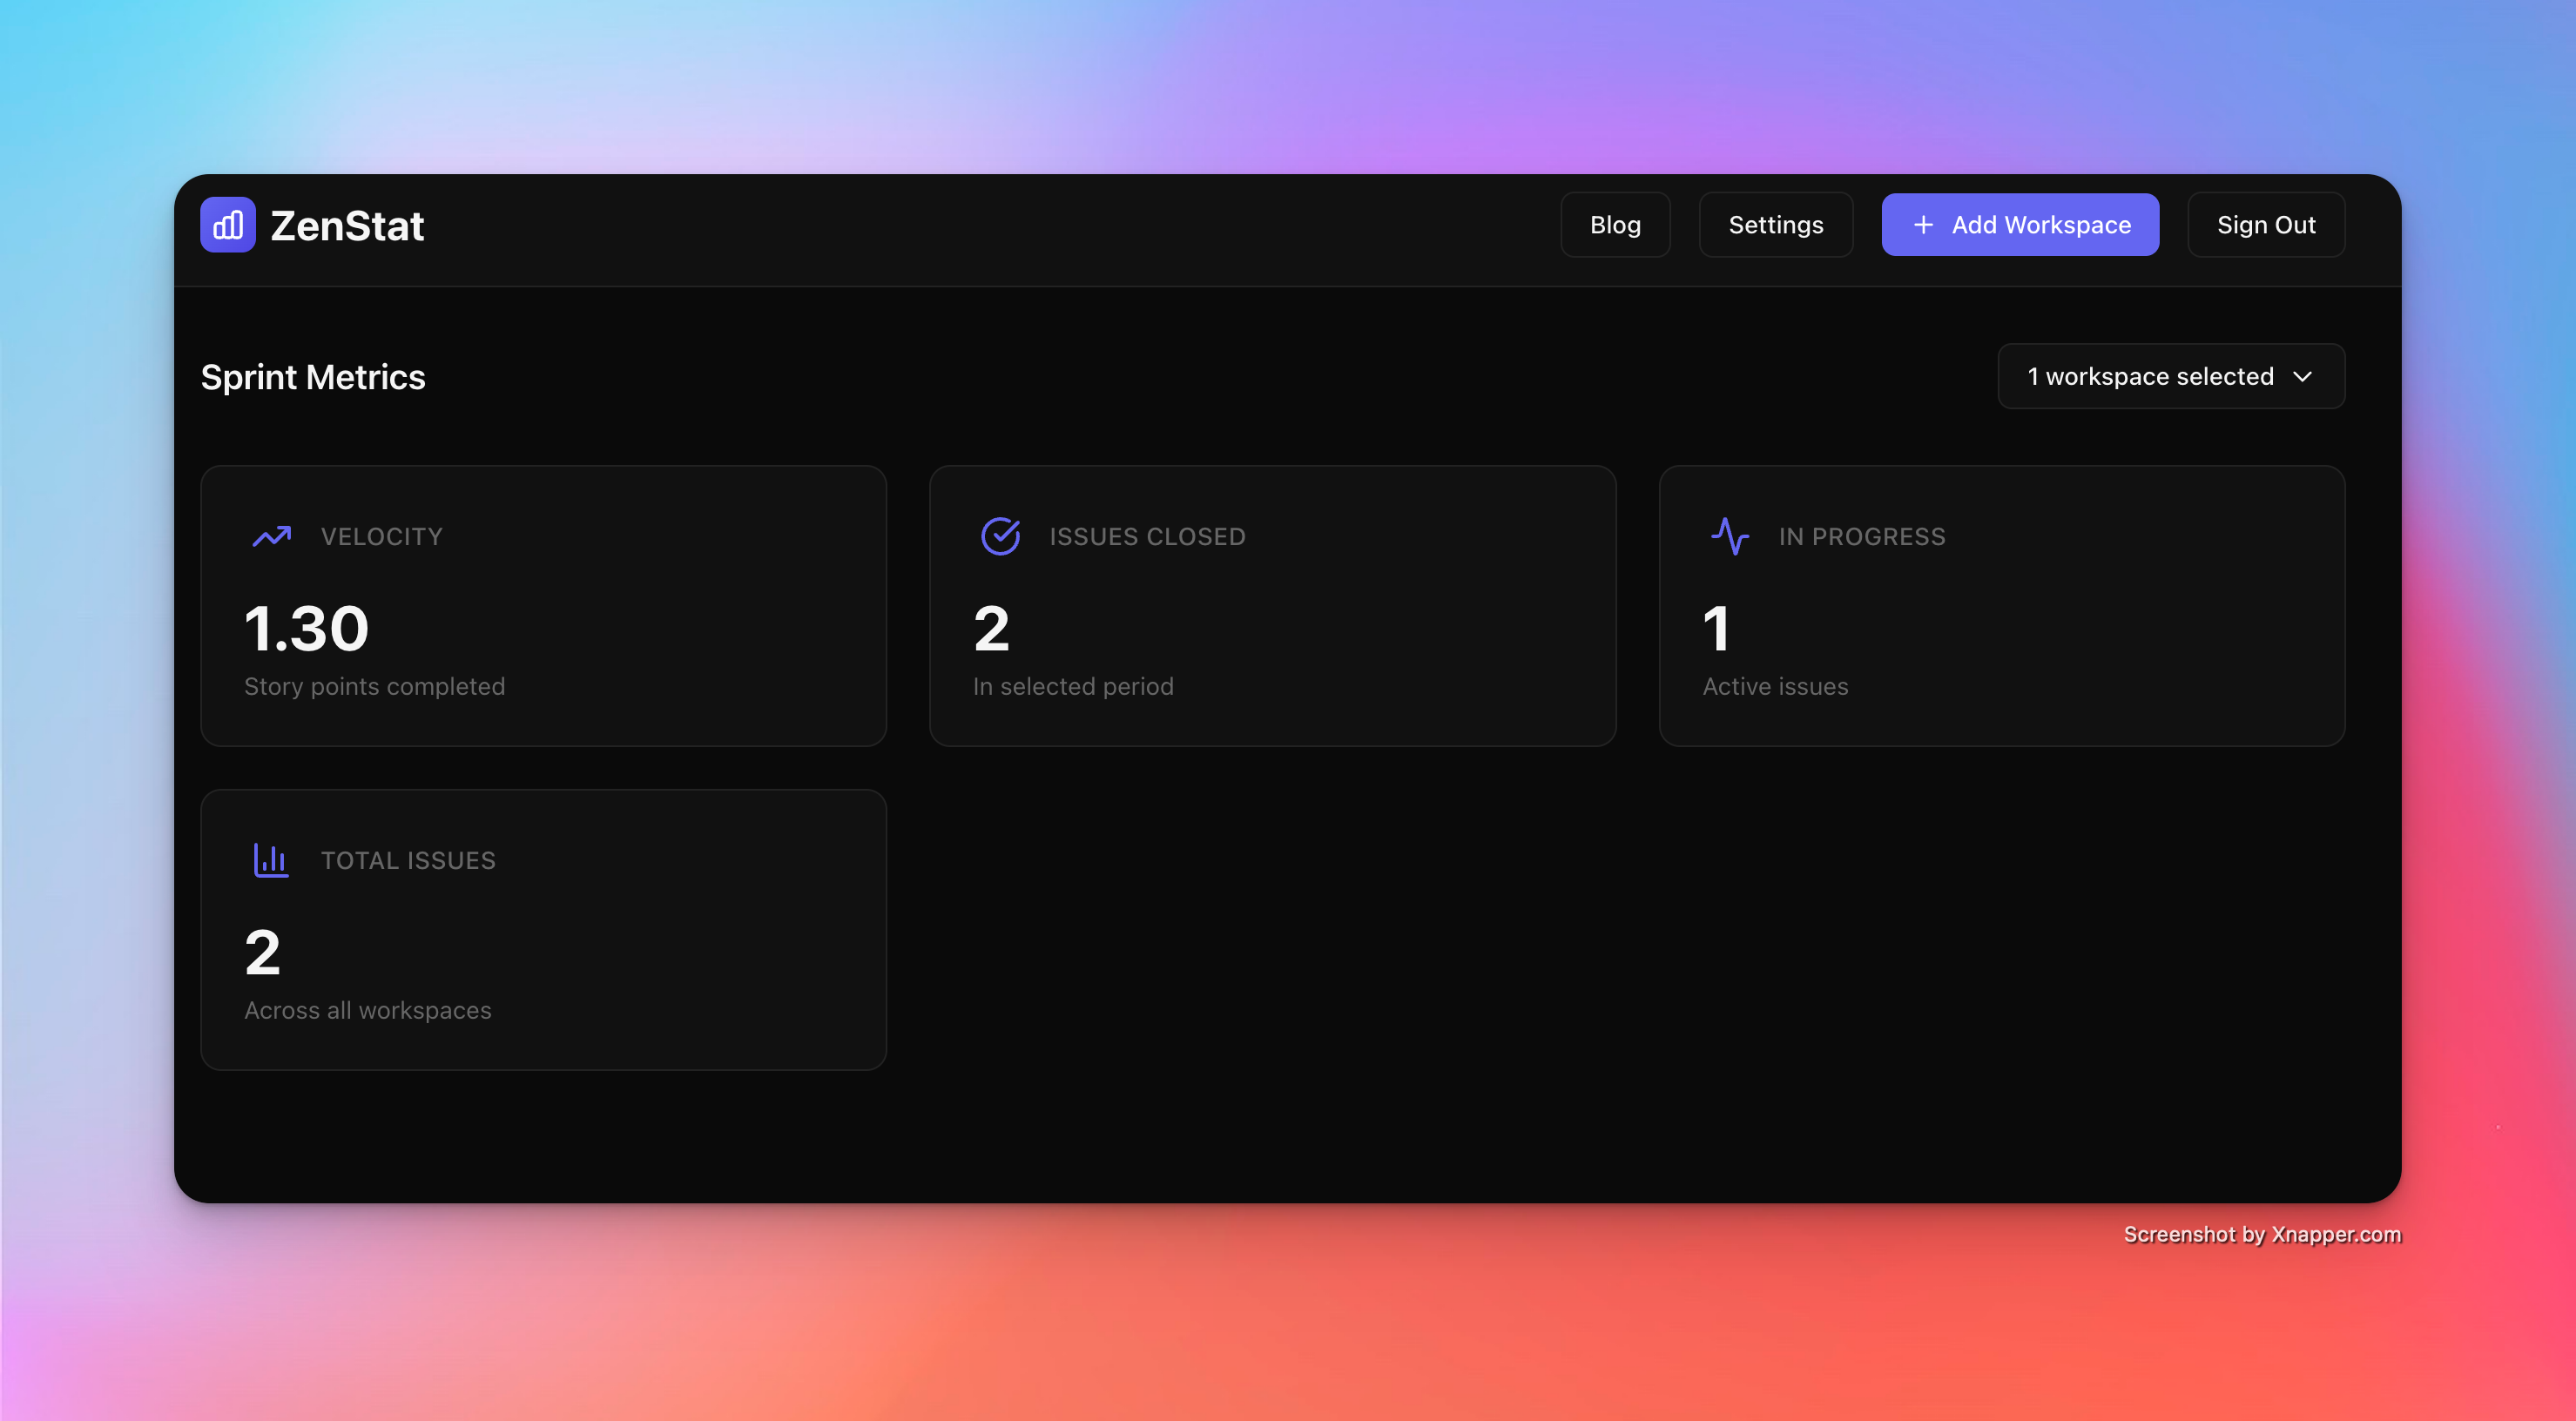
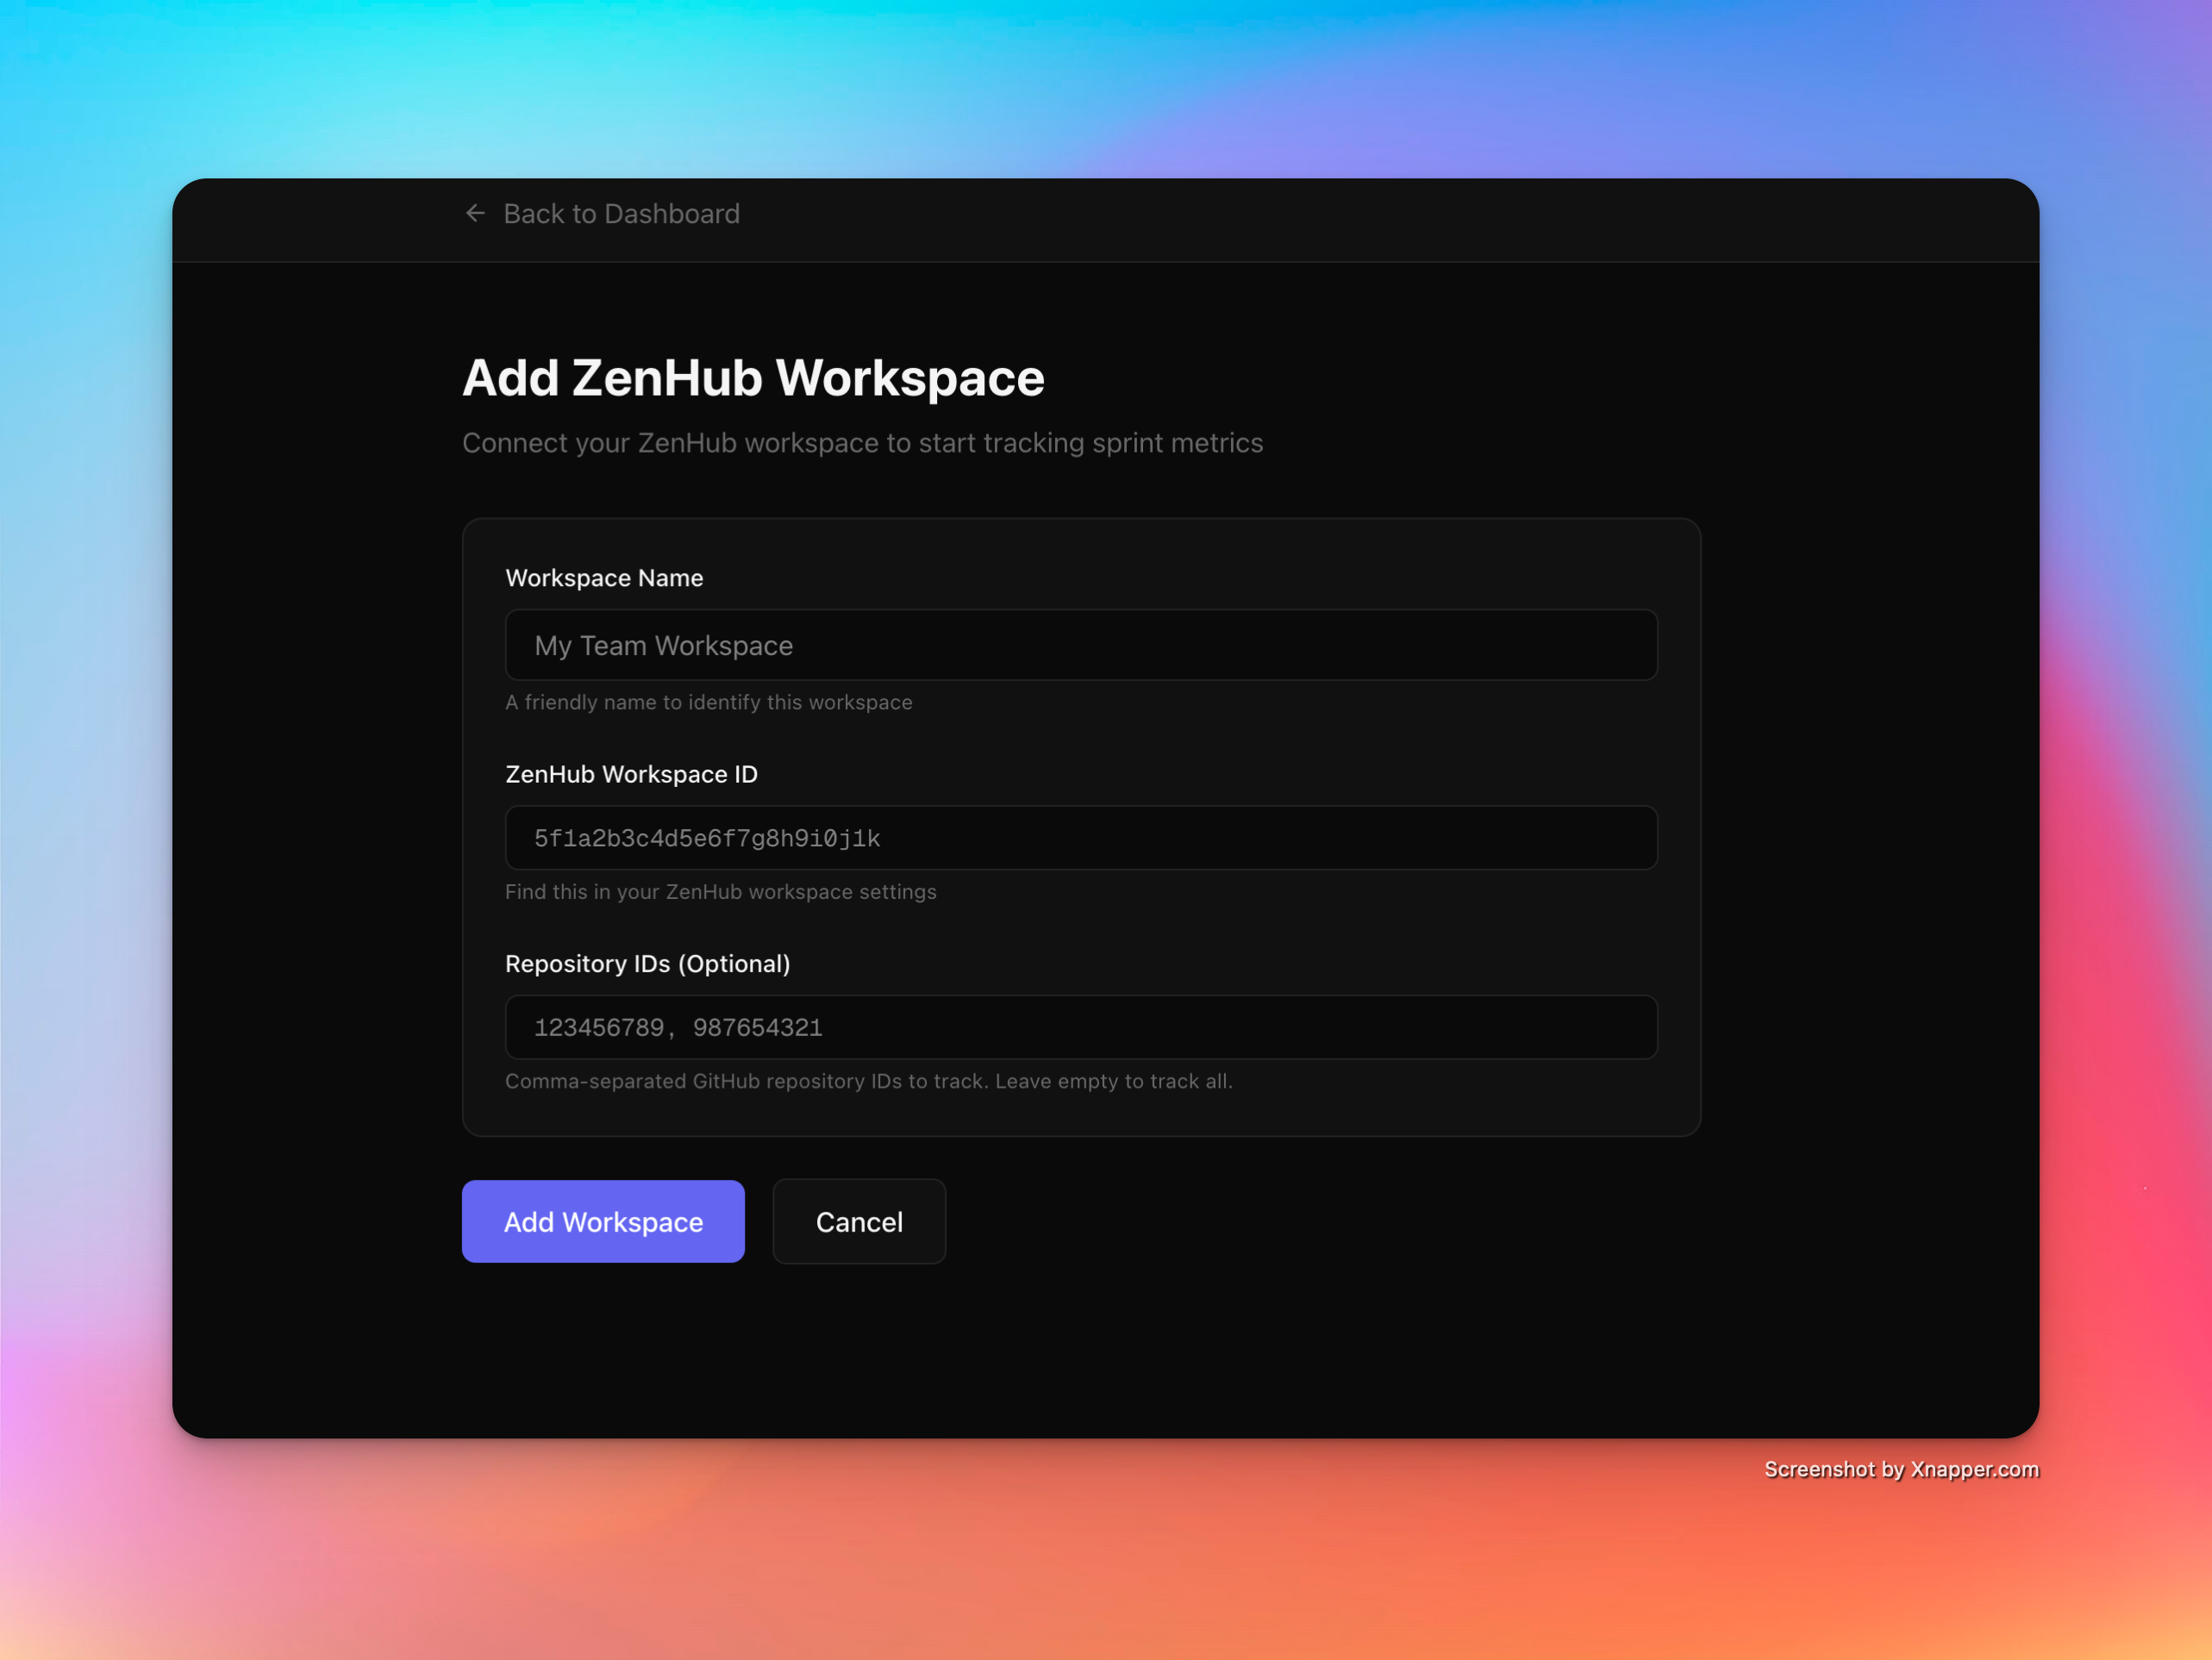
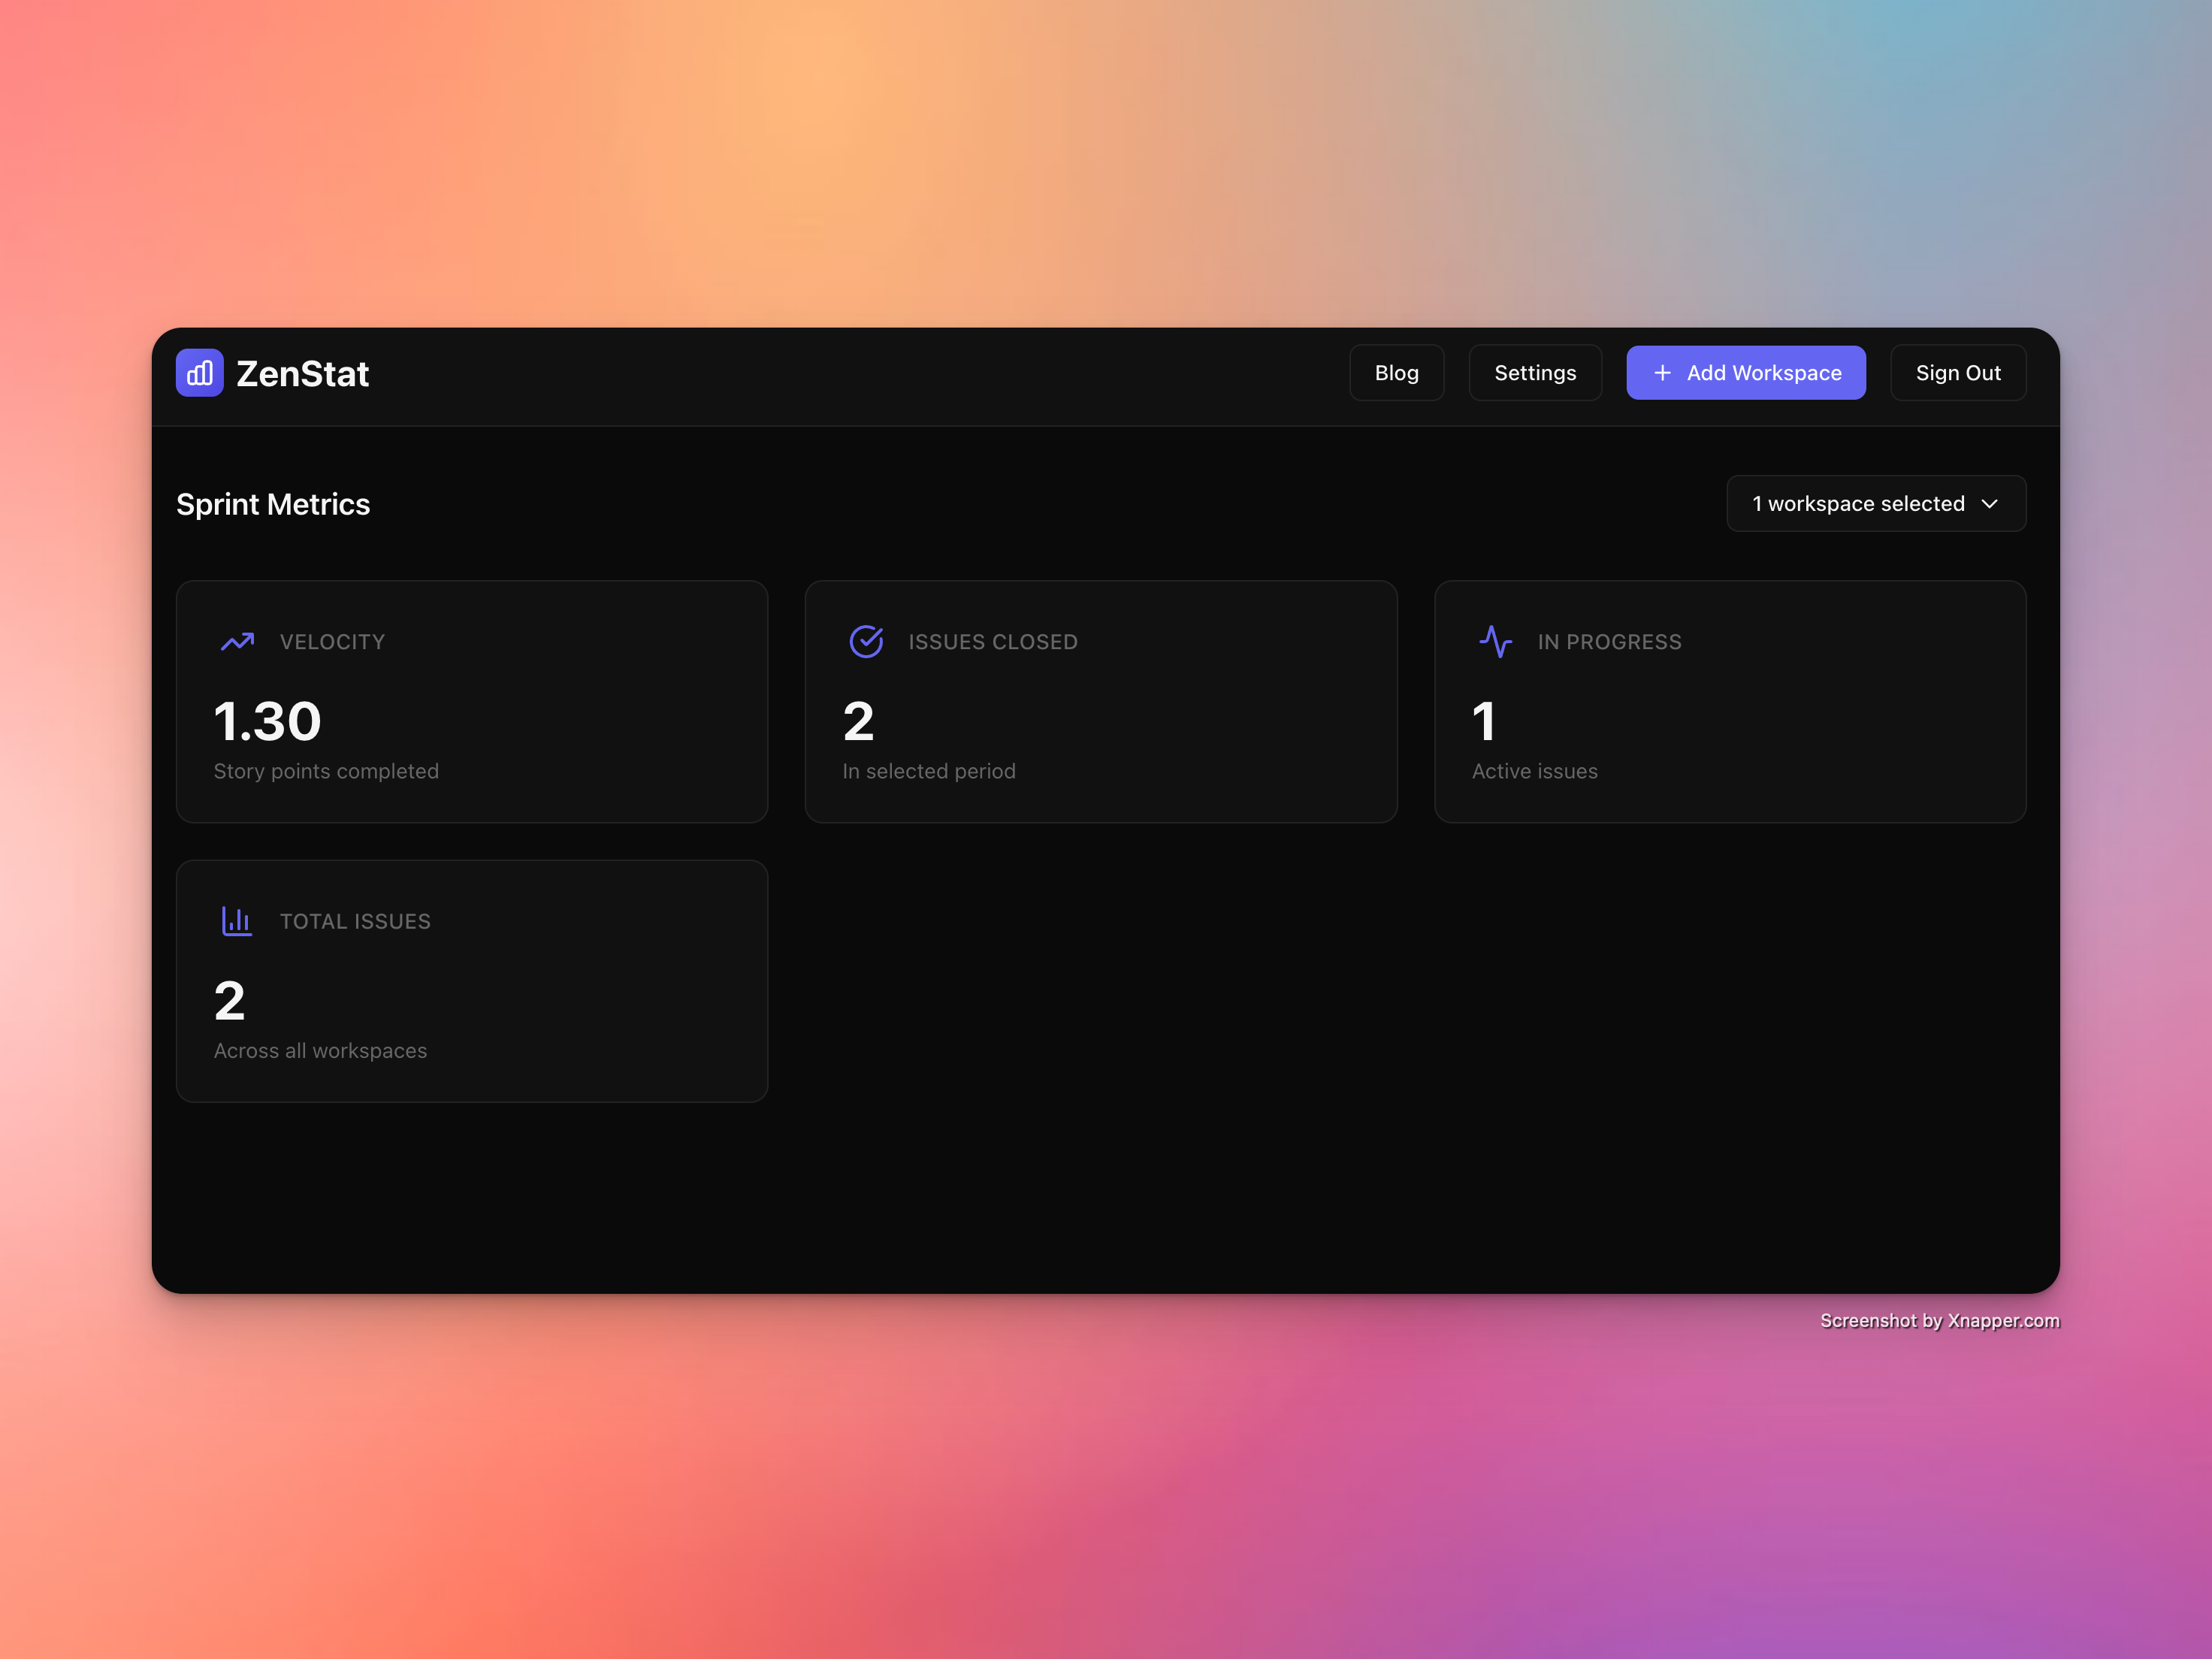
ZenStat automatically ingests your ZenHub issues and gives you a unified view of your team’s health across multiple ZenHub workspaces.
Identify hidden bottlenecks through cycle time metrics, understand team pace via velocity charts, and share burndown charts with stakeholders. ZenStat requires no complicated setup just connect your GitHub repository and see results instantly.
Use Cases
- Multiple scrum teams
- Project overview across workspaces
- Comparing team analytics

Comments


Congratulations on the launch of Zenstat it’s always exciting to see new tools helping teams better understand their data and performance. I specialize in creating short SaaS demo and promo videos that clearly show how a product works, highlight its key value, and help attract more users. I’d love to share a quick concept idea for a 60-second promo video tailored specifically to Zenstat would you be open to seeing it?

Useful for teams already in the ZenHub ecosystem. One gap I notice: cycle time and velocity metrics are great, but without any annotation or comment layer, it's hard to explain why a sprint went off-track when sharing burndown charts with stakeholders. Adding a simple notes field per sprint would make the reports more actionable in retrospectives.
Premium Products


Sponsors
BuyMakers
Makers
Comments
Congratulations on the launch of Zenstat it’s always exciting to see new tools helping teams better understand their data and performance. I specialize in creating short SaaS demo and promo videos that clearly show how a product works, highlight its key value, and help attract more users. I’d love to share a quick concept idea for a 60-second promo video tailored specifically to Zenstat would you be open to seeing it?
Useful for teams already in the ZenHub ecosystem. One gap I notice: cycle time and velocity metrics are great, but without any annotation or comment layer, it's hard to explain why a sprint went off-track when sharing burndown charts with stakeholders. Adding a simple notes field per sprint would make the reports more actionable in retrospectives.
Premium Products
New to Fazier?

Find your next favorite product or submit your own. Made by @FalakDigital.
Copyright ©2025. All Rights Reserved