
RabbitGUI
Debug, monitor, and manage RabbitMQ with a modern IDE
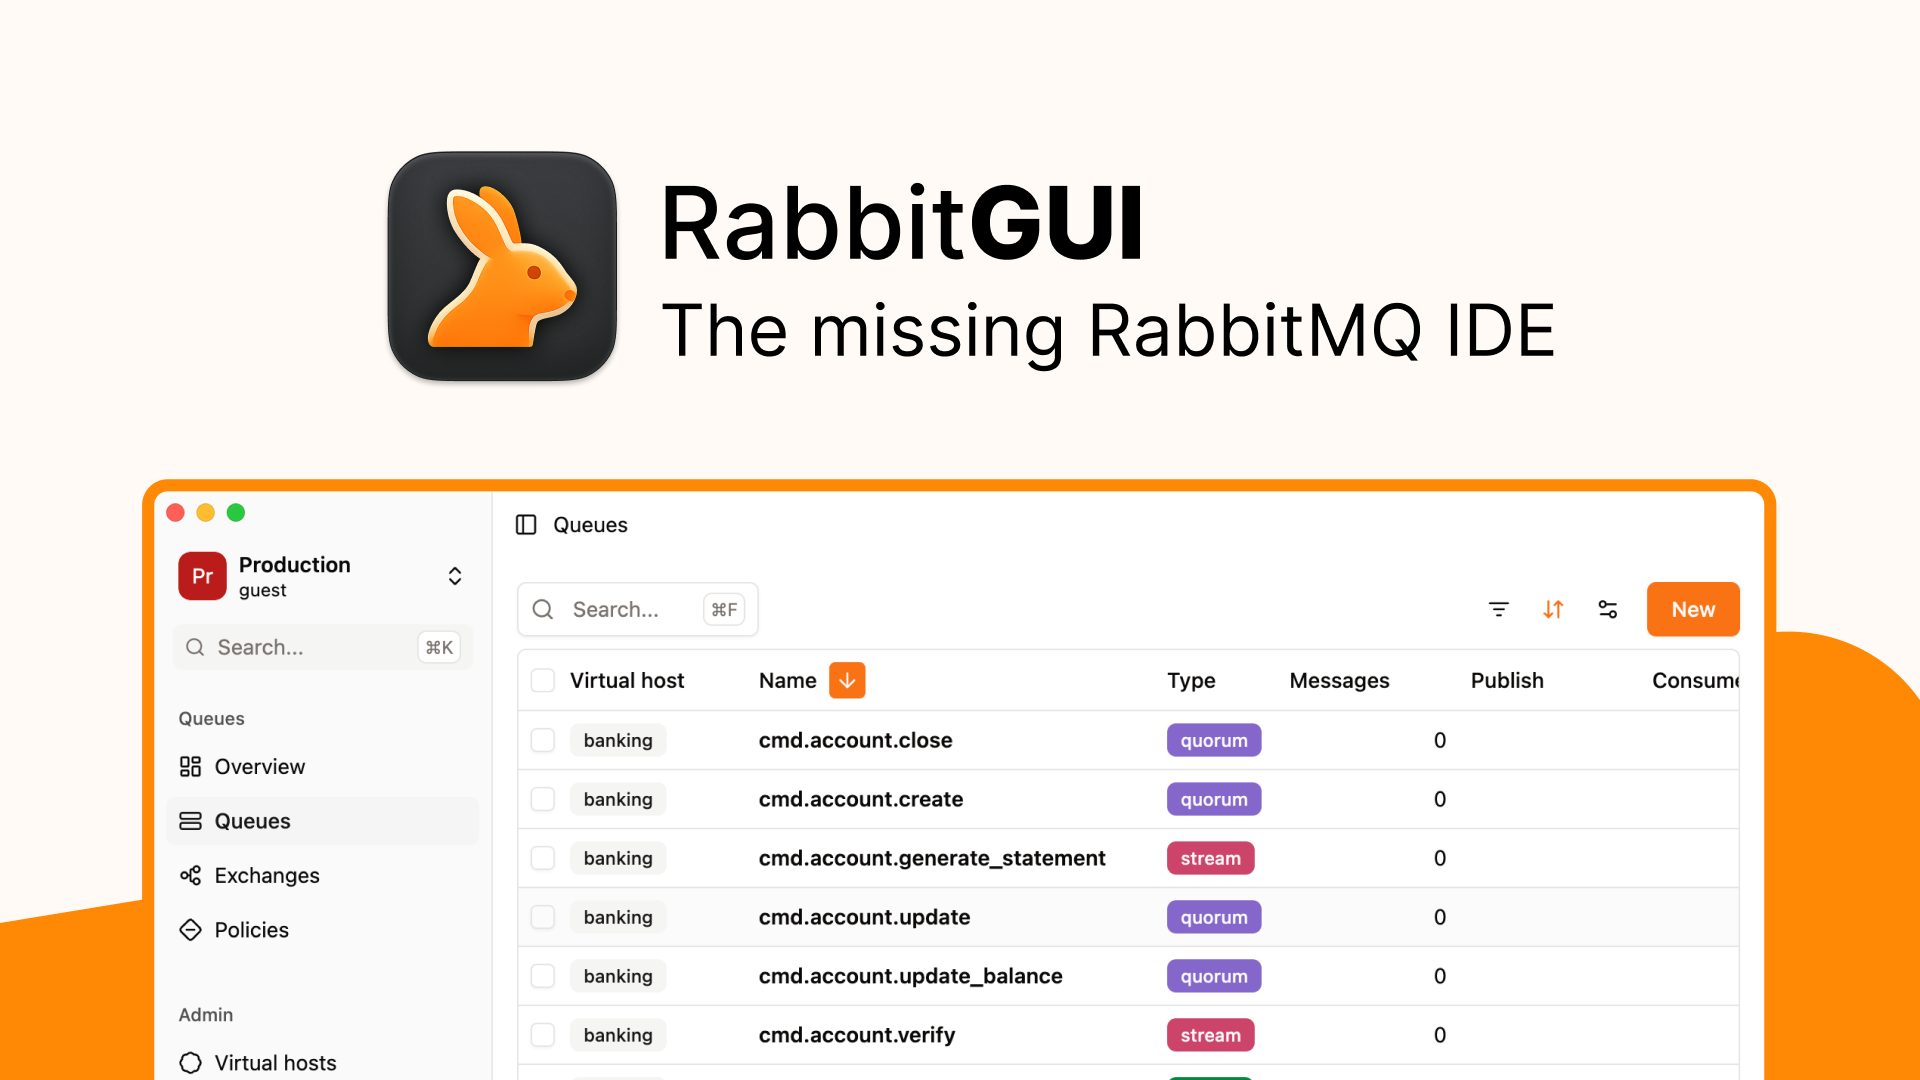
RabbitGUI is a modern desktop GUI for RabbitMQ that makes it easy to debug, monitor, and manage queues and message flows. Inspect live traffic without consuming messages, manage dead-letter queues, visualize routing, edit JSON messages, and switch between environments from one fast developer-focused interface.
Features
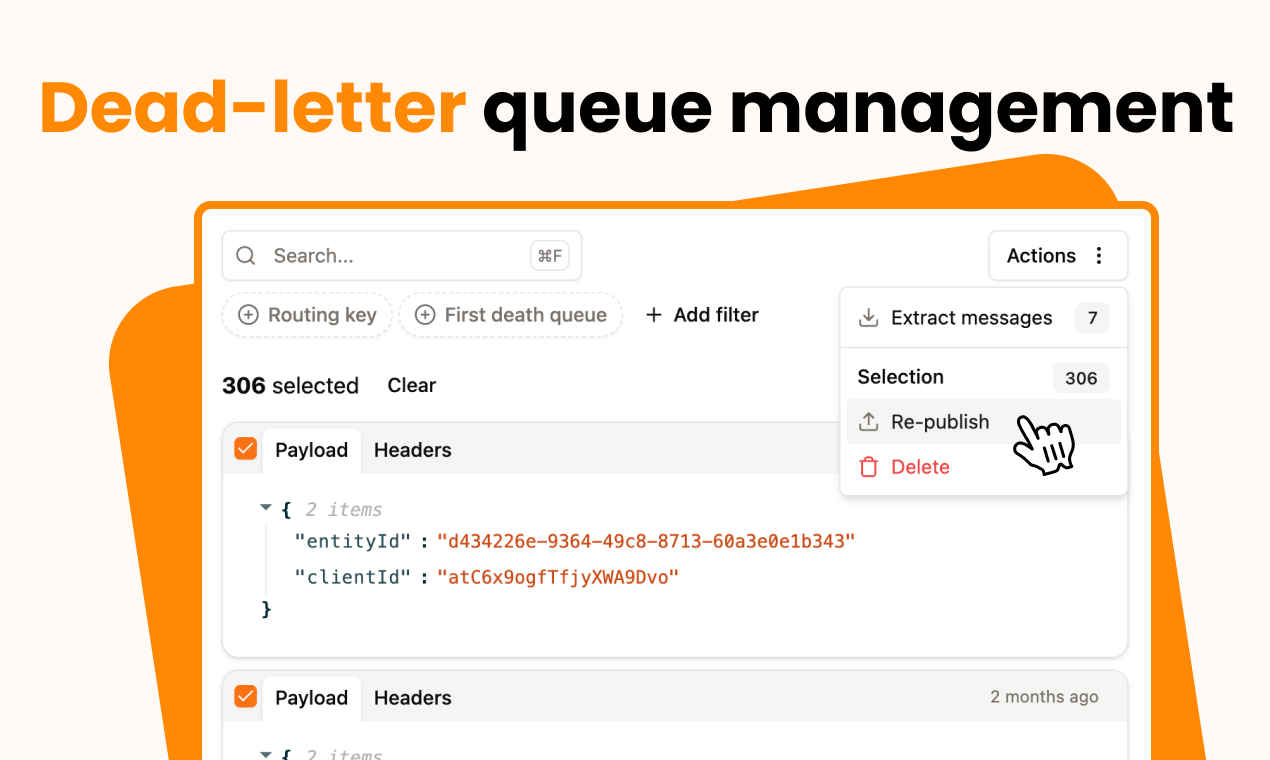
- Dead-letter queue management: Search, filter, select, and republish messages, with optional throttling.
- Live queue inspection: Spy on messages in real time without consuming them.
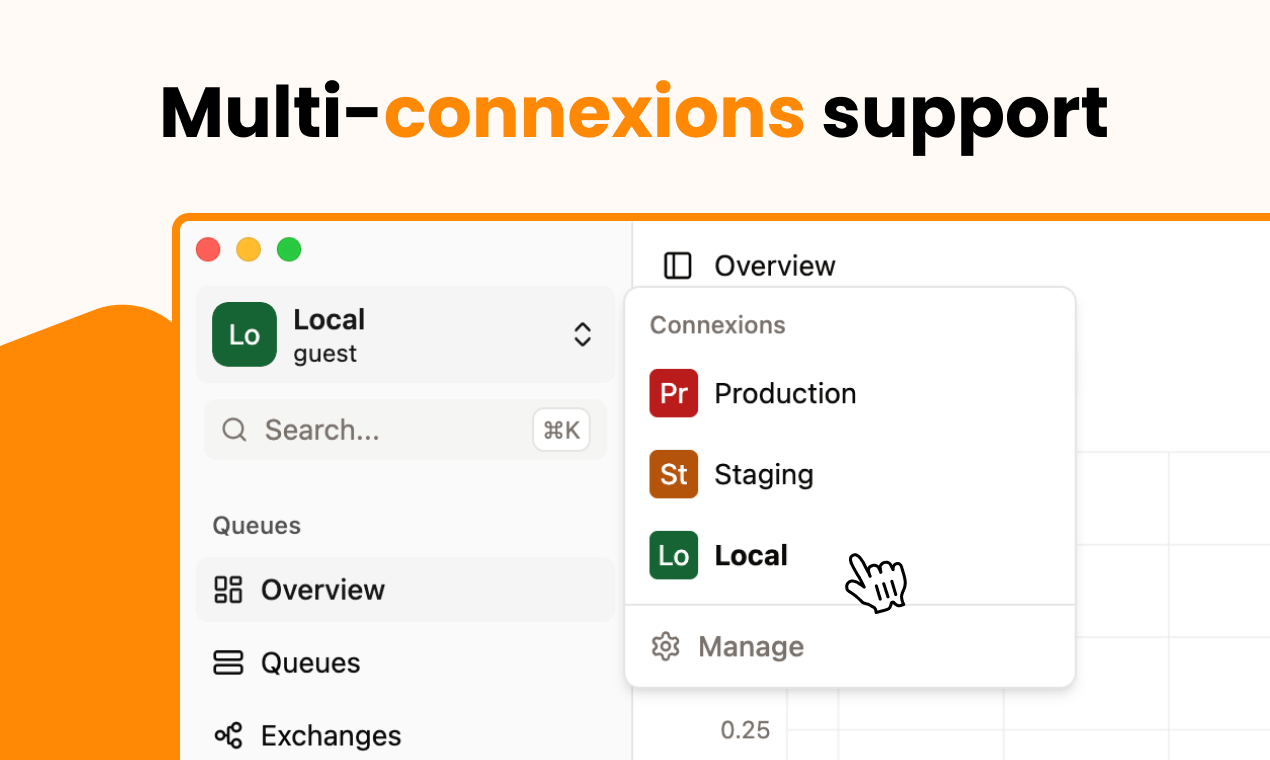
- Multi-environment support: Manage local, staging, and production RabbitMQ instances from one workspace.
- Visual routing: Explore exchanges, queues, bindings, dead-letter exchanges, and message flows visually.
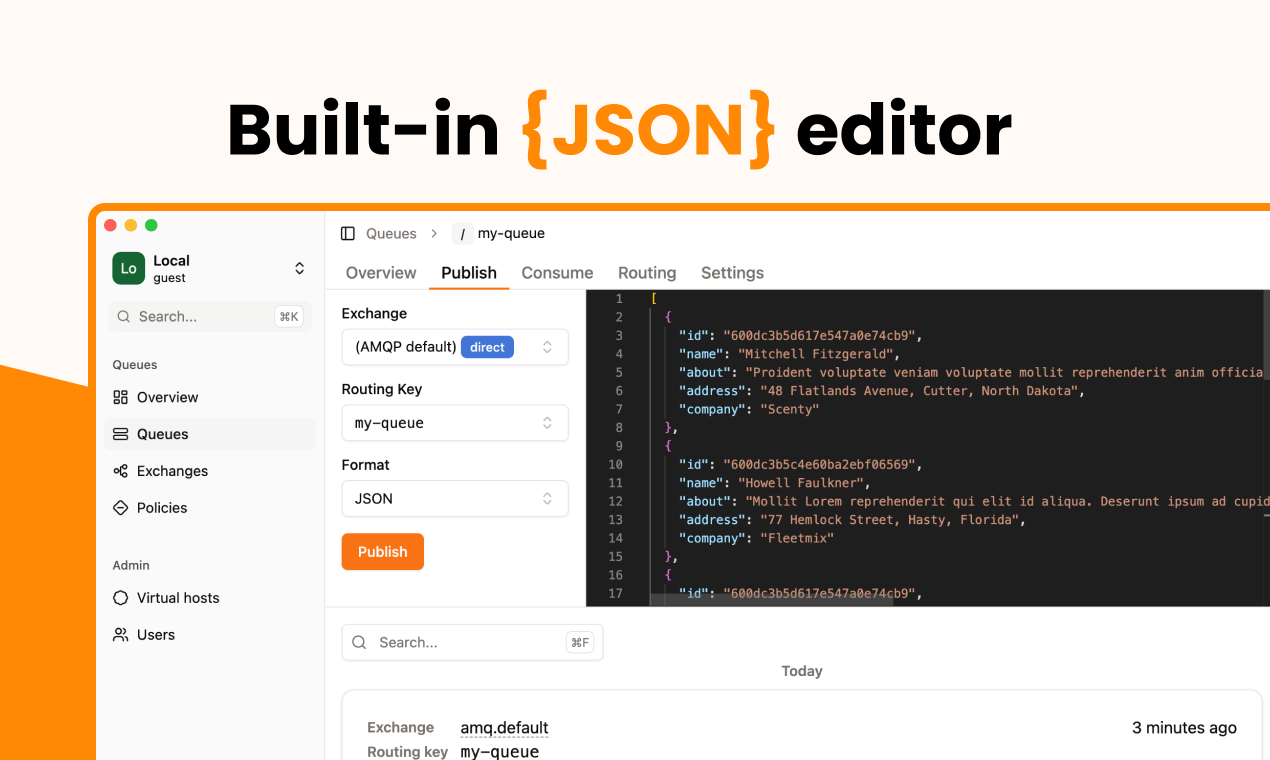
- JSON editor: Inspect and edit messages with syntax highlighting, validation, and routing-key autocompletion.
- Queue analytics: Interactive time-series charts and backlog drain-time forecasts.
- Powerful search: Quickly find queues, exchanges, policies, and virtual hosts.
- Bindings management: Visualize and manage routing bindings in one place.
- Policy debugger: Understand which policies apply to a queue and identify configuration conflicts.
- Bulk actions: Manage multiple queues, exchanges, and policies at once.
- Custom views: Create personalized views with filters and custom columns.
- Built-in RabbitMQ docs: Access helpful configuration references without leaving the app.
Use Cases
- Debug failed messages: Inspect dead-lettered messages and republish them after fixing the underlying issue.
- Troubleshoot production systems: Safely inspect live queue traffic without consuming messages.
- Manage multiple environments: Quickly switch between development, staging, and production RabbitMQ instances.
- Understand message routing: Visualize how exchanges, bindings, queues, and dead-letter flows connect.
- Monitor queue backlogs: Track queue behavior and estimate how long a backlog will take to drain.
- Test and replay messages: Edit JSON payloads and republish messages to specific destinations.
- Investigate RabbitMQ policies: See exactly how policies affect queues and resolve configuration issues.
- Operate RabbitMQ faster: Replace repetitive CLI or management-console workflows with a focused desktop interface.

Comments


I built RabbitGUI because working with RabbitMQ often meant jumping between the management UI, CLI tools, scripts, and a lot of manual message handling. The biggest pain point was debugging real-world message flows, especially dead-letter queues. I wanted a tool where I could safely inspect messages, understand how they got there, edit and replay them, and quickly see what was happening across different environments. RabbitGUI is my attempt to make that workflow much faster and more pleasant for developers. It’s still evolving, and I’d love to hear from people who work with RabbitMQ: what’s the most painful part of debugging or managing your queues today?
Premium Products



























Sponsors
Buy

Makers
Makers
Comments
I built RabbitGUI because working with RabbitMQ often meant jumping between the management UI, CLI tools, scripts, and a lot of manual message handling. The biggest pain point was debugging real-world message flows, especially dead-letter queues. I wanted a tool where I could safely inspect messages, understand how they got there, edit and replay them, and quickly see what was happening across different environments. RabbitGUI is my attempt to make that workflow much faster and more pleasant for developers. It’s still evolving, and I’d love to hear from people who work with RabbitMQ: what’s the most painful part of debugging or managing your queues today?
Premium Products
New to Fazier?

Find your next favorite product or submit your own. Made by @FalakDigital.
Copyright ©2025. All Rights Reserved